
|
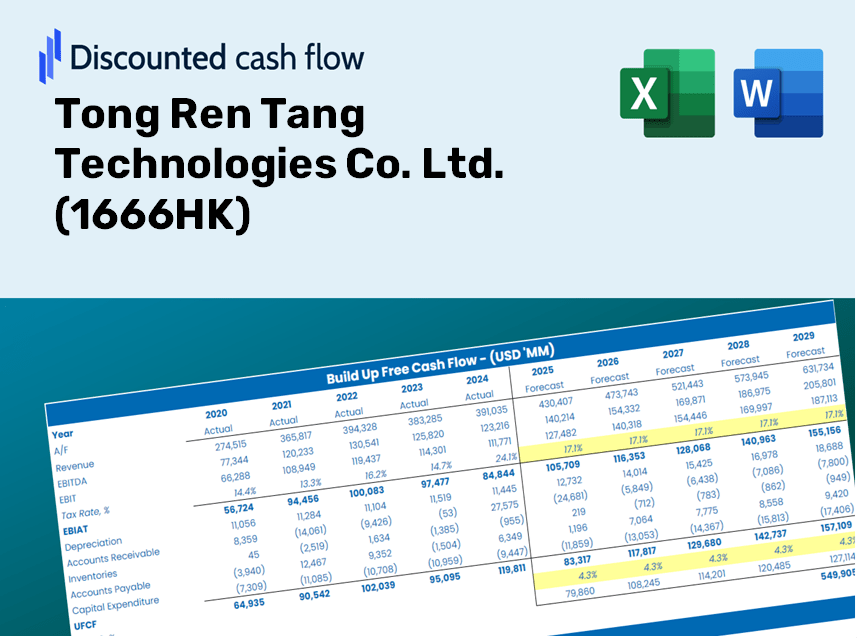
Tong Ren Tang Technologies Co. Ltd. (1666.HK) DCF Valuation |
Fully Editable: Tailor To Your Needs In Excel Or Sheets
Professional Design: Trusted, Industry-Standard Templates
Investor-Approved Valuation Models
MAC/PC Compatible, Fully Unlocked
No Expertise Is Needed; Easy To Follow
Tong Ren Tang Technologies Co. Ltd. (1666.HK) Bundle
Looking to evaluate the intrinsic value of Tong Ren Tang Technologies Co. Ltd.? Our (1666HK) DCF Calculator integrates real-world data with comprehensive customization features, enabling you to adjust forecasts and make more informed investment choices.
Discounted Cash Flow (DCF) - (USD MM)
| Year | AY1 2020 |
AY2 2021 |
AY3 2022 |
AY4 2023 |
AY5 2024 |
FY1 2025 |
FY2 2026 |
FY3 2027 |
FY4 2028 |
FY5 2029 |
|---|---|---|---|---|---|---|---|---|---|---|
| Revenue | 5,037.7 | 5,904.9 | 6,551.5 | 7,406.1 | 7,937.7 | 8,897.9 | 9,974.2 | 11,180.8 | 12,533.3 | 14,049.4 |
| Revenue Growth, % | 0 | 17.21 | 10.95 | 13.04 | 7.18 | 12.1 | 12.1 | 12.1 | 12.1 | 12.1 |
| EBITDA | 1,247.3 | 1,372.6 | 1,522.4 | 1,424.0 | 1,280.7 | 1,897.1 | 2,126.6 | 2,383.8 | 2,672.2 | 2,995.4 |
| EBITDA, % | 24.76 | 23.25 | 23.24 | 19.23 | 16.13 | 21.32 | 21.32 | 21.32 | 21.32 | 21.32 |
| Depreciation | 215.6 | 192.3 | 196.0 | 203.5 | 203.5 | 281.9 | 316.0 | 354.2 | 397.0 | 445.0 |
| Depreciation, % | 4.28 | 3.26 | 2.99 | 2.75 | 2.56 | 3.17 | 3.17 | 3.17 | 3.17 | 3.17 |
| EBIT | 1,031.7 | 1,180.3 | 1,326.4 | 1,220.5 | 1,077.2 | 1,615.2 | 1,810.6 | 2,029.6 | 2,275.1 | 2,550.4 |
| EBIT, % | 20.48 | 19.99 | 20.25 | 16.48 | 13.57 | 18.15 | 18.15 | 18.15 | 18.15 | 18.15 |
| Total Cash | 3,810.6 | 4,250.9 | 4,573.1 | 4,633.8 | 4,790.5 | 6,056.8 | 6,789.5 | 7,610.8 | 8,531.5 | 9,563.5 |
| Total Cash, percent | .0 | .0 | .0 | .0 | .0 | .0 | .0 | .0 | .0 | .0 |
| Account Receivables | 1,142.4 | 1,304.6 | 1,637.1 | 971.3 | 1,206.6 | 1,745.3 | 1,956.5 | 2,193.1 | 2,458.4 | 2,755.8 |
| Account Receivables, % | 22.68 | 22.09 | 24.99 | 13.11 | 15.2 | 19.62 | 19.62 | 19.62 | 19.62 | 19.62 |
| Inventories | 2,988.6 | 3,113.0 | 3,541.7 | 5,187.6 | 5,648.5 | 5,468.8 | 6,130.4 | 6,871.9 | 7,703.2 | 8,635.0 |
| Inventories, % | 59.33 | 52.72 | 54.06 | 70.04 | 71.16 | 61.46 | 61.46 | 61.46 | 61.46 | 61.46 |
| Accounts Payable | 784.9 | 977.2 | 900.1 | 1,505.3 | 1,110.1 | 1,426.8 | 1,599.4 | 1,792.9 | 2,009.8 | 2,252.9 |
| Accounts Payable, % | 15.58 | 16.55 | 13.74 | 20.33 | 13.98 | 16.04 | 16.04 | 16.04 | 16.04 | 16.04 |
| Capital Expenditure | -596.9 | -171.0 | -172.7 | -113.0 | -190.4 | -379.1 | -425.0 | -476.4 | -534.1 | -598.7 |
| Capital Expenditure, % | -11.85 | -2.9 | -2.64 | -1.53 | -2.4 | -4.26 | -4.26 | -4.26 | -4.26 | -4.26 |
| Tax Rate, % | 50.83 | 50.83 | 50.83 | 50.83 | 50.83 | 50.83 | 50.83 | 50.83 | 50.83 | 50.83 |
| EBITAT | 513.4 | 572.9 | 637.9 | 619.6 | 529.6 | 795.8 | 892.0 | 999.9 | 1,120.9 | 1,256.5 |
| Depreciation | ||||||||||
| Changes in Account Receivables | ||||||||||
| Changes in Inventories | ||||||||||
| Changes in Accounts Payable | ||||||||||
| Capital Expenditure | ||||||||||
| UFCF | -3,214.1 | 499.9 | -177.1 | 335.3 | -548.8 | 656.2 | 82.9 | 92.9 | 104.2 | 116.8 |
| WACC, % | 6.23 | 6.22 | 6.22 | 6.25 | 6.23 | 6.23 | 6.23 | 6.23 | 6.23 | 6.23 |
| PV UFCF | ||||||||||
| SUM PV UFCF | 936.8 | |||||||||
| Long Term Growth Rate, % | 0.50 | |||||||||
| Free cash flow (T + 1) | 117 | |||||||||
| Terminal Value | 2,048 | |||||||||
| Present Terminal Value | 1,514 | |||||||||
| Enterprise Value | 2,451 | |||||||||
| Net Debt | -1,863 | |||||||||
| Equity Value | 4,314 | |||||||||
| Diluted Shares Outstanding, MM | 1,281 | |||||||||
| Equity Value Per Share | 3.37 |
What You Will Receive
- Authentic 1666HK Financials: Access both historical and projected data for precise valuation.
- Customizable Inputs: Adjust WACC, tax rates, revenue growth, and capital expenditures to suit your analysis.
- Dynamic Calculations: Automatic computation of intrinsic value and NPV in real-time.
- Scenario Planning: Explore various scenarios to assess Tong Ren Tang Technologies' future performance.
- User-Friendly Design: Designed for professionals while remaining accessible for those new to the field.
Key Features
- Accurate Financial Data: Gain access to reliable historical performance and future forecasts for Tong Ren Tang Technologies Co. Ltd. (1666HK).
- Flexible Forecasting Inputs: Customize projections by modifying highlighted fields, including WACC, growth rates, and profit margins.
- Real-Time Calculations: Automatically refresh DCF, Net Present Value (NPV), and cash flow assessments.
- User-Friendly Dashboard: Intuitive charts and summaries to clearly present your valuation outcomes.
- Suitable for All Levels: Designed with a straightforward layout for investors, CFOs, and consultants alike.
How It Works
- Step 1: Download the Excel file.
- Step 2: Review pre-filled Tong Ren Tang Technologies Co. Ltd. (1666HK) data (historical and projected).
- Step 3: Modify key assumptions (yellow cells) based on your evaluation.
- Step 4: Check automatic recalculations for Tong Ren Tang’s intrinsic value.
- Step 5: Leverage the results for investment decisions or reporting.
Why Select This Calculator for Tong Ren Tang Technologies Co. Ltd. (1666HK)?
- Precision: Utilizes authentic financial data for Tong Ren Tang, ensuring reliable results.
- Versatility: Built for users to effortlessly adjust and explore various input scenarios.
- Efficiency: Avoid the complexities of creating a DCF model from the ground up.
- High-Quality: Crafted with the expertise and functionality expected at the CFO level.
- Intuitive: Simplified access for users with little to no experience in financial modeling.
Who Can Benefit from This Product?
- Finance Students: Master valuation techniques and apply them using authentic market data related to Tong Ren Tang Technologies Co. Ltd. (1666HK).
- Academics: Integrate professional financial models into your lectures or research projects involving Tong Ren Tang Technologies.
- Investors: Evaluate your investment hypotheses and analyze valuation results for Tong Ren Tang Technologies Co. Ltd. (1666HK).
- Financial Analysts: Enhance your efficiency with a customizable DCF model tailored for Tong Ren Tang Technologies Co. Ltd. (1666HK).
- Small Business Owners: Discover how major public companies like Tong Ren Tang Technologies are assessed and valued.
Contents of the Template
- Historical Data: Features Tong Ren Tang Technologies Co. Ltd. (1666HK)'s previous financial performance and foundational forecasts.
- DCF and Levered DCF Models: Comprehensive templates for assessing the intrinsic value of Tong Ren Tang Technologies Co. Ltd. (1666HK).
- WACC Sheet: Built-in calculations for the Weighted Average Cost of Capital.
- Editable Inputs: Customize essential metrics such as growth rates, EBITDA percentages, and CAPEX assumptions.
- Quarterly and Annual Statements: A thorough analysis of Tong Ren Tang Technologies Co. Ltd. (1666HK)'s financials.
- Interactive Dashboard: Dynamically visualize valuation outcomes and forecasts.
Disclaimer
All information, articles, and product details provided on this website are for general informational and educational purposes only. We do not claim any ownership over, nor do we intend to infringe upon, any trademarks, copyrights, logos, brand names, or other intellectual property mentioned or depicted on this site. Such intellectual property remains the property of its respective owners, and any references here are made solely for identification or informational purposes, without implying any affiliation, endorsement, or partnership.
We make no representations or warranties, express or implied, regarding the accuracy, completeness, or suitability of any content or products presented. Nothing on this website should be construed as legal, tax, investment, financial, medical, or other professional advice. In addition, no part of this site—including articles or product references—constitutes a solicitation, recommendation, endorsement, advertisement, or offer to buy or sell any securities, franchises, or other financial instruments, particularly in jurisdictions where such activity would be unlawful.
All content is of a general nature and may not address the specific circumstances of any individual or entity. It is not a substitute for professional advice or services. Any actions you take based on the information provided here are strictly at your own risk. You accept full responsibility for any decisions or outcomes arising from your use of this website and agree to release us from any liability in connection with your use of, or reliance upon, the content or products found herein.