
|
Hazama Ando Corporation (1719.T) DCF Valuation |
Fully Editable: Tailor To Your Needs In Excel Or Sheets
Professional Design: Trusted, Industry-Standard Templates
Investor-Approved Valuation Models
MAC/PC Compatible, Fully Unlocked
No Expertise Is Needed; Easy To Follow
Hazama Ando Corporation (1719.T) Bundle
Make more informed investment choices with the (1719T) DCF Calculator! Explore genuine Hazama Ando Corporation financials, adjust growth projections and expenses, and instantly observe how these alterations affect the intrinsic value of (1719T).
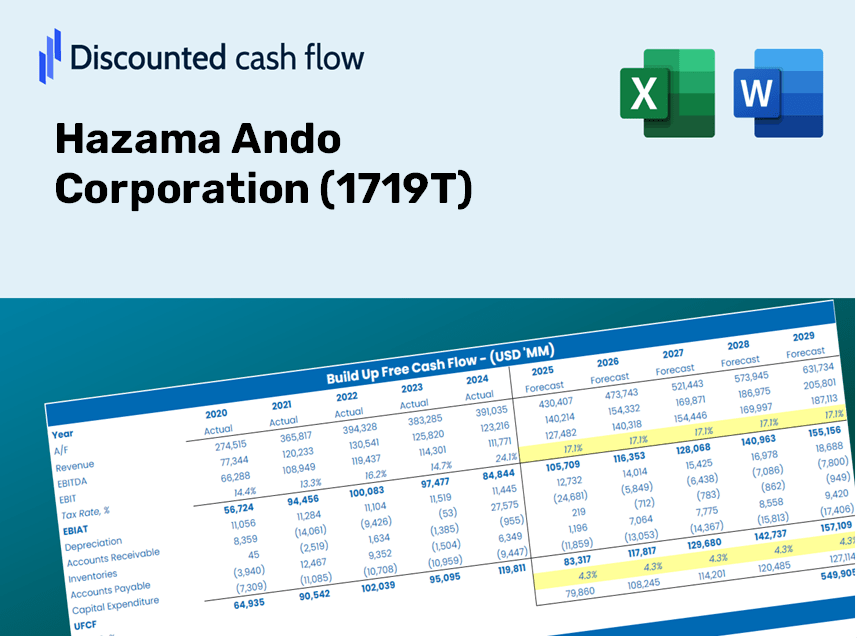
Discounted Cash Flow (DCF) - (USD MM)
| Year | AY1 2021 |
AY2 2022 |
AY3 2023 |
AY4 2024 |
AY5 2025 |
FY1 2026 |
FY2 2027 |
FY3 2028 |
FY4 2029 |
FY5 2030 |
|---|---|---|---|---|---|---|---|---|---|---|
| Revenue | 352,000.0 | 340,292.0 | 372,146.0 | 394,128.0 | 425,160.0 | 446,221.4 | 468,326.2 | 491,525.9 | 515,875.0 | 541,430.2 |
| Revenue Growth, % | 0 | -3.33 | 9.36 | 5.91 | 7.87 | 4.95 | 4.95 | 4.95 | 4.95 | 4.95 |
| EBITDA | 27,499.0 | 28,120.0 | 21,954.0 | 21,848.0 | 42,328.0 | 33,443.5 | 35,100.3 | 36,839.0 | 38,664.0 | 40,579.3 |
| EBITDA, % | 7.81 | 8.26 | 5.9 | 5.54 | 9.96 | 7.49 | 7.49 | 7.49 | 7.49 | 7.49 |
| Depreciation | 2,080.0 | 2,410.0 | 2,100.0 | 2,495.0 | 3,504.0 | 2,963.5 | 3,110.3 | 3,264.3 | 3,426.1 | 3,595.8 |
| Depreciation, % | 0.59091 | 0.70822 | 0.56429 | 0.63304 | 0.82416 | 0.66412 | 0.66412 | 0.66412 | 0.66412 | 0.66412 |
| EBIT | 25,419.0 | 25,710.0 | 19,854.0 | 19,353.0 | 38,824.0 | 30,480.1 | 31,990.0 | 33,574.7 | 35,237.9 | 36,983.5 |
| EBIT, % | 7.22 | 7.56 | 5.34 | 4.91 | 9.13 | 6.83 | 6.83 | 6.83 | 6.83 | 6.83 |
| Total Cash | 129,317.0 | 66,080.0 | 75,597.0 | 50,212.0 | 57,294.0 | 91,641.5 | 96,181.2 | 100,945.8 | 105,946.4 | 111,194.7 |
| Total Cash, percent | .0 | .0 | .0 | .0 | .0 | .0 | .0 | .0 | .0 | .0 |
| Account Receivables | 121,378.0 | 140,417.0 | 144,934.0 | 181,348.0 | 213,929.0 | 188,324.4 | 197,653.6 | 207,444.9 | 217,721.2 | 228,506.6 |
| Account Receivables, % | 34.48 | 41.26 | 38.95 | 46.01 | 50.32 | 42.2 | 42.2 | 42.2 | 42.2 | 42.2 |
| Inventories | 14,710.0 | 12,005.0 | 10,746.0 | 9,154.0 | 8,269.0 | 13,263.4 | 13,920.4 | 14,610.0 | 15,333.8 | 16,093.4 |
| Inventories, % | 4.18 | 3.53 | 2.89 | 2.32 | 1.94 | 2.97 | 2.97 | 2.97 | 2.97 | 2.97 |
| Accounts Payable | 70,624.0 | 47,134.0 | 54,474.0 | 55,315.0 | 58,138.0 | 68,059.2 | 71,430.7 | 74,969.2 | 78,683.0 | 82,580.7 |
| Accounts Payable, % | 20.06 | 13.85 | 14.64 | 14.03 | 13.67 | 15.25 | 15.25 | 15.25 | 15.25 | 15.25 |
| Capital Expenditure | -2,934.0 | -2,558.0 | -2,999.0 | -7,077.0 | -4,126.0 | -4,602.5 | -4,830.5 | -5,069.8 | -5,320.9 | -5,584.5 |
| Capital Expenditure, % | -0.83352 | -0.75171 | -0.80587 | -1.8 | -0.97046 | -1.03 | -1.03 | -1.03 | -1.03 | -1.03 |
| Tax Rate, % | 30.94 | 30.94 | 30.94 | 30.94 | 30.94 | 30.94 | 30.94 | 30.94 | 30.94 | 30.94 |
| EBITAT | 17,415.5 | 17,893.7 | 13,521.8 | 14,200.1 | 26,810.4 | 21,253.7 | 22,306.5 | 23,411.5 | 24,571.3 | 25,788.5 |
| Depreciation | ||||||||||
| Changes in Account Receivables | ||||||||||
| Changes in Inventories | ||||||||||
| Changes in Accounts Payable | ||||||||||
| Capital Expenditure | ||||||||||
| UFCF | -48,902.5 | -22,078.3 | 16,704.8 | -24,362.9 | -2,684.6 | 50,146.0 | 13,971.6 | 14,663.7 | 15,390.2 | 16,152.5 |
| WACC, % | 5.18 | 5.19 | 5.18 | 5.2 | 5.18 | 5.19 | 5.19 | 5.19 | 5.19 | 5.19 |
| PV UFCF | ||||||||||
| SUM PV UFCF | 98,017.6 | |||||||||
| Long Term Growth Rate, % | 1.00 | |||||||||
| Free cash flow (T + 1) | 16,314 | |||||||||
| Terminal Value | 389,704 | |||||||||
| Present Terminal Value | 302,649 | |||||||||
| Enterprise Value | 400,667 | |||||||||
| Net Debt | -29,396 | |||||||||
| Equity Value | 430,063 | |||||||||
| Diluted Shares Outstanding, MM | 157 | |||||||||
| Equity Value Per Share | 2,744.42 |
What You Will Receive
- Customizable Excel Template: A fully adjustable Excel-based DCF Calculator featuring pre-populated financial data for Hazama Ando Corporation (1719T).
- Accurate Data: Historical figures and future estimates (highlighted in the yellow cells).
- Flexible Forecasting: Adjust forecast inputs such as revenue growth, EBITDA margins, and WACC.
- Instant Calculations: Quickly observe how your adjustments affect Hazama Ando's valuation.
- Professional Resource: Designed for investors, CFOs, consultants, and financial analysts.
- Intuitive Interface: Organized for straightforward navigation and accompanied by step-by-step guidance.
Core Advantages
- Customizable Projection Inputs: Adjust key metrics such as revenue growth, operating margins, and capital investments.
- Instant DCF Valuation: Automatically determines intrinsic value, net present value, and additional results in real-time.
- High-Precision Accuracy: Utilizes Hazama Ando Corporation’s (1719T) actual financial data to deliver credible valuation results.
- Effortless Scenario Testing: Easily explore varying assumptions and assess different outcomes.
- Time-Efficient Solution: Remove the hassle of constructing intricate valuation models from the ground up.
How It Functions
- Step 1: Download the Excel spreadsheet.
- Step 2: Examine the pre-filled data for Hazama Ando Corporation (1719T) (historical and projected).
- Step 3: Modify key assumptions (highlighted in yellow) according to your evaluation.
- Step 4: Observe the automatic recalculations for Hazama Ando Corporation's intrinsic value.
- Step 5: Utilize the results for investment analysis or reporting purposes.
Why Opt for This Calculator?
- Reliable Data: Access up-to-date Hazama Ando Corporation (1719T) financials for trustworthy valuation outcomes.
- Fully Customizable: Tailor essential parameters such as growth rates, WACC, and tax rates to suit your forecasts.
- Time-Efficient: Built-in calculations save you the hassle of starting from zero.
- Professional-Grade Resource: Crafted specifically for investors, analysts, and consultants in the field.
- User-Friendly Design: An intuitive interface and comprehensive guidance ensure accessibility for all users.
Who Can Benefit from This Product?
- Individual Investors: Make well-informed choices regarding the purchase or sale of Hazama Ando Corporation (1719T) stock.
- Financial Analysts: Enhance your valuation processes with pre-built financial models tailored for Hazama Ando Corporation (1719T).
- Consultants: Provide clients with accurate and timely valuation insights related to Hazama Ando Corporation (1719T).
- Business Owners: Gain insights into the valuation of large companies like Hazama Ando Corporation (1719T) to refine your own business strategies.
- Finance Students: Acquire practical valuation skills through real-world data and scenarios involving Hazama Ando Corporation (1719T).
Contents of the Template
- Operating and Balance Sheet Data: Pre-filled historical data and forecasts for Hazama Ando Corporation (1719T), including revenue, EBITDA, EBIT, and capital expenditures.
- WACC Calculation: A dedicated sheet for Weighted Average Cost of Capital (WACC), featuring parameters such as Beta, risk-free rate, and share price.
- DCF Valuation (Unlevered and Levered): Customizable Discounted Cash Flow models that present intrinsic value along with comprehensive calculations.
- Financial Statements: Pre-loaded financial statements (annual and quarterly) to facilitate thorough analysis.
- Key Ratios: Includes profitability, leverage, and efficiency ratios specific to Hazama Ando Corporation (1719T).
- Dashboard and Charts: A visual summary of valuation outputs and assumptions for easy result analysis.
Disclaimer
All information, articles, and product details provided on this website are for general informational and educational purposes only. We do not claim any ownership over, nor do we intend to infringe upon, any trademarks, copyrights, logos, brand names, or other intellectual property mentioned or depicted on this site. Such intellectual property remains the property of its respective owners, and any references here are made solely for identification or informational purposes, without implying any affiliation, endorsement, or partnership.
We make no representations or warranties, express or implied, regarding the accuracy, completeness, or suitability of any content or products presented. Nothing on this website should be construed as legal, tax, investment, financial, medical, or other professional advice. In addition, no part of this site—including articles or product references—constitutes a solicitation, recommendation, endorsement, advertisement, or offer to buy or sell any securities, franchises, or other financial instruments, particularly in jurisdictions where such activity would be unlawful.
All content is of a general nature and may not address the specific circumstances of any individual or entity. It is not a substitute for professional advice or services. Any actions you take based on the information provided here are strictly at your own risk. You accept full responsibility for any decisions or outcomes arising from your use of this website and agree to release us from any liability in connection with your use of, or reliance upon, the content or products found herein.