
|
Time Interconnect Technology Limited (1729.HK) DCF Valuation |
Fully Editable: Tailor To Your Needs In Excel Or Sheets
Professional Design: Trusted, Industry-Standard Templates
Investor-Approved Valuation Models
MAC/PC Compatible, Fully Unlocked
No Expertise Is Needed; Easy To Follow
Time Interconnect Technology Limited (1729.HK) Bundle
Discover the true value of Time Interconnect Technology Limited (1729HK) with our advanced DCF Calculator! Adjust key assumptions, explore various scenarios, and assess how different factors influence the valuation of Time Interconnect Technology Limited (1729HK) – all within a user-friendly Excel template.
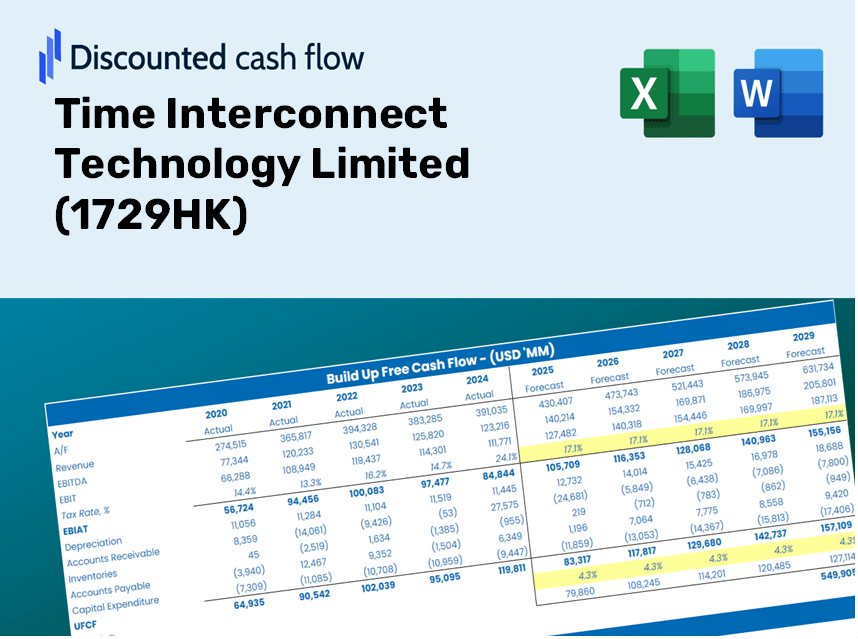
Discounted Cash Flow (DCF) - (USD MM)
| Year | AY1 2020 |
AY2 2021 |
AY3 2022 |
AY4 2023 |
AY5 2024 |
FY1 2025 |
FY2 2026 |
FY3 2027 |
FY4 2028 |
FY5 2029 |
|---|---|---|---|---|---|---|---|---|---|---|
| Revenue | 3,008.0 | 3,590.1 | 5,764.8 | 6,435.0 | 7,388.8 | 9,353.7 | 11,841.1 | 14,990.0 | 18,976.4 | 24,022.8 |
| Revenue Growth, % | 0 | 19.35 | 60.58 | 11.62 | 14.82 | 26.59 | 26.59 | 26.59 | 26.59 | 26.59 |
| EBITDA | 389.5 | 345.1 | 326.0 | 647.2 | 710.5 | 895.9 | 1,134.1 | 1,435.8 | 1,817.6 | 2,300.9 |
| EBITDA, % | 12.95 | 9.61 | 5.65 | 10.06 | 9.62 | 9.58 | 9.58 | 9.58 | 9.58 | 9.58 |
| Depreciation | 71.9 | 73.8 | 16.2 | 98.4 | 101.6 | 142.8 | 180.7 | 228.8 | 289.7 | 366.7 |
| Depreciation, % | 2.39 | 2.06 | 0.28179 | 1.53 | 1.37 | 1.53 | 1.53 | 1.53 | 1.53 | 1.53 |
| EBIT | 317.6 | 271.3 | 309.7 | 548.8 | 609.0 | 753.1 | 953.4 | 1,206.9 | 1,527.9 | 1,934.2 |
| EBIT, % | 10.56 | 7.56 | 5.37 | 8.53 | 8.24 | 8.05 | 8.05 | 8.05 | 8.05 | 8.05 |
| Total Cash | 174.2 | 247.2 | 1,262.7 | 378.3 | 425.8 | 864.7 | 1,094.6 | 1,385.7 | 1,754.3 | 2,220.8 |
| Total Cash, percent | .0 | .0 | .0 | .0 | .0 | .0 | .0 | .0 | .0 | .0 |
| Account Receivables | 795.5 | 1,094.0 | 1,523.3 | 2,297.9 | 1,553.6 | 2,620.5 | 3,317.4 | 4,199.6 | 5,316.4 | 6,730.2 |
| Account Receivables, % | 26.45 | 30.47 | 26.42 | 35.71 | 21.03 | 28.02 | 28.02 | 28.02 | 28.02 | 28.02 |
| Inventories | 474.9 | 653.6 | 2,050.6 | 1,310.3 | 1,391.1 | 2,034.5 | 2,575.5 | 3,260.5 | 4,127.5 | 5,225.2 |
| Inventories, % | 15.79 | 18.21 | 35.57 | 20.36 | 18.83 | 21.75 | 21.75 | 21.75 | 21.75 | 21.75 |
| Accounts Payable | 507.4 | 795.1 | 867.3 | 845.6 | 1,396.5 | 1,610.7 | 2,039.1 | 2,581.3 | 3,267.8 | 4,136.8 |
| Accounts Payable, % | 16.87 | 22.15 | 15.05 | 13.14 | 18.9 | 17.22 | 17.22 | 17.22 | 17.22 | 17.22 |
| Capital Expenditure | -46.8 | -59.4 | -213.5 | -80.5 | -179.7 | -198.2 | -250.9 | -317.6 | -402.0 | -509.0 |
| Capital Expenditure, % | -1.55 | -1.65 | -3.7 | -1.25 | -2.43 | -2.12 | -2.12 | -2.12 | -2.12 | -2.12 |
| Tax Rate, % | 15.84 | 15.84 | 15.84 | 15.84 | 15.84 | 15.84 | 15.84 | 15.84 | 15.84 | 15.84 |
| EBITAT | 268.1 | 196.0 | 260.1 | 444.1 | 512.5 | 611.1 | 773.6 | 979.4 | 1,239.8 | 1,569.5 |
| Depreciation | ||||||||||
| Changes in Account Receivables | ||||||||||
| Changes in Inventories | ||||||||||
| Changes in Accounts Payable | ||||||||||
| Capital Expenditure | ||||||||||
| UFCF | -469.7 | 20.9 | -1,691.1 | 405.9 | 1,648.8 | -940.4 | -106.1 | -134.3 | -170.0 | -215.2 |
| WACC, % | 5.1 | 5.07 | 5.1 | 5.09 | 5.1 | 5.09 | 5.09 | 5.09 | 5.09 | 5.09 |
| PV UFCF | ||||||||||
| SUM PV UFCF | -1,413.8 | |||||||||
| Long Term Growth Rate, % | 2.00 | |||||||||
| Free cash flow (T + 1) | -220 | |||||||||
| Terminal Value | -7,094 | |||||||||
| Present Terminal Value | -5,534 | |||||||||
| Enterprise Value | -6,947 | |||||||||
| Net Debt | 1,021 | |||||||||
| Equity Value | -7,969 | |||||||||
| Diluted Shares Outstanding, MM | 1,990 | |||||||||
| Equity Value Per Share | -4.00 |
What You'll Receive
- Comprehensive Financial Model: Utilize Time Interconnect Technology Limited's (1729HK) actual data for accurate DCF valuations.
- Complete Forecast Customization: Modify revenue growth, profit margins, WACC, and other essential variables.
- Real-Time Calculations: Automatic updates provide instant feedback on your adjustments.
- Professional-Grade Template: A polished Excel file tailored for sophisticated valuation needs.
- Flexible and Reusable: Designed for adaptability, allowing you to create detailed forecasts repeatedly.
Key Features
- Pre-Loaded Data: Historical financial statements and pre-filled forecasts for Time Interconnect Technology Limited (1729HK).
- Fully Adjustable Inputs: Modify WACC, tax rates, revenue growth, and EBITDA margins to suit your analysis.
- Instant Results: Witness real-time recalculations of Time Interconnect Technology Limited’s (1729HK) intrinsic value.
- Clear Visual Outputs: Dashboard charts effectively present valuation results and critical metrics.
- Built for Accuracy: A professional-grade tool designed for analysts, investors, and finance professionals.
How It Works
- Step 1: Download the prebuilt Excel template featuring Time Interconnect Technology Limited’s (1729HK) data.
- Step 2: Review the pre-filled sheets to familiarize yourself with the essential metrics.
- Step 3: Adjust forecasts and assumptions in the editable yellow cells (WACC, growth, margins).
- Step 4: Immediately see the recalculated results, including Time Interconnect Technology Limited’s (1729HK) intrinsic value.
- Step 5: Use the outputs to make informed investment decisions or to create detailed reports.
Why Opt for This Calculator?
- Designed for Experts: A sophisticated tool tailored for analysts, CFOs, and consultants.
- Comprehensive Data: Time Interconnect Technology Limited's historical and projected financials preloaded for precision.
- Forecast Simulation: Easily model various scenarios and assumptions.
- Clear Results: Instantly computes intrinsic value, NPV, and essential metrics.
- User-Friendly: Step-by-step guidance ensures a smooth experience.
Who Can Benefit from This Product?
- Investors: Evaluate Time Interconnect Technology Limited’s (1729HK) valuation before making stock trades.
- CFOs and Financial Analysts: Enhance valuation workflows and validate financial forecasts.
- Startup Founders: Gain insights on how established public companies like Time Interconnect Technology Limited (1729HK) are valued.
- Consultants: Create comprehensive valuation reports for your clients.
- Students and Educators: Utilize real-time data to practice and teach valuation methodologies.
Contents of the Template
- Pre-Filled Data: Contains historical financials and forecasts for Time Interconnect Technology Limited (1729HK).
- Discounted Cash Flow Model: An editable DCF valuation model featuring automatic calculations.
- Weighted Average Cost of Capital (WACC): A dedicated worksheet for calculating WACC based on user-defined inputs.
- Key Financial Ratios: Assess Time Interconnect Technology Limited's profitability, efficiency, and leverage.
- Customizable Inputs: Easily modify revenue growth, margins, and tax rates.
- Clear Dashboard: Visual summaries through charts and tables presenting key valuation results.
Disclaimer
All information, articles, and product details provided on this website are for general informational and educational purposes only. We do not claim any ownership over, nor do we intend to infringe upon, any trademarks, copyrights, logos, brand names, or other intellectual property mentioned or depicted on this site. Such intellectual property remains the property of its respective owners, and any references here are made solely for identification or informational purposes, without implying any affiliation, endorsement, or partnership.
We make no representations or warranties, express or implied, regarding the accuracy, completeness, or suitability of any content or products presented. Nothing on this website should be construed as legal, tax, investment, financial, medical, or other professional advice. In addition, no part of this site—including articles or product references—constitutes a solicitation, recommendation, endorsement, advertisement, or offer to buy or sell any securities, franchises, or other financial instruments, particularly in jurisdictions where such activity would be unlawful.
All content is of a general nature and may not address the specific circumstances of any individual or entity. It is not a substitute for professional advice or services. Any actions you take based on the information provided here are strictly at your own risk. You accept full responsibility for any decisions or outcomes arising from your use of this website and agree to release us from any liability in connection with your use of, or reliance upon, the content or products found herein.