
|
Central Holding Group Co. Ltd. (1735.HK) DCF Valuation |
Fully Editable: Tailor To Your Needs In Excel Or Sheets
Professional Design: Trusted, Industry-Standard Templates
Investor-Approved Valuation Models
MAC/PC Compatible, Fully Unlocked
No Expertise Is Needed; Easy To Follow
Central Holding Group Co. Ltd. (1735.HK) Bundle
Optimize your time and improve precision with our (1735HK) DCF Calculator! Incorporating real data from Central Holding Group Co. Ltd. and customizable assumptions, this tool empowers you to forecast, analyze, and value (Company) like a seasoned investor.
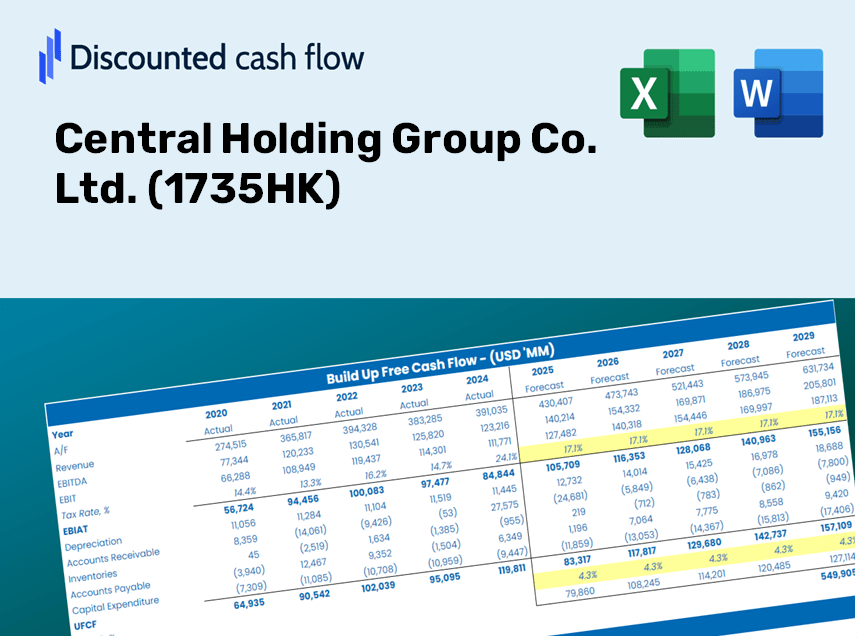
Discounted Cash Flow (DCF) - (USD MM)
| Year | AY1 2018 |
AY2 2019 |
AY3 2020 |
AY4 2021 |
AY5 2022 |
FY1 2023 |
FY2 2024 |
FY3 2025 |
FY4 2026 |
FY5 2027 |
|---|---|---|---|---|---|---|---|---|---|---|
| Revenue | 199.2 | 180.4 | 413.7 | 1,086.2 | 1,613.6 | 2,578.3 | 4,119.7 | 6,582.4 | 10,517.5 | 16,805.1 |
| Revenue Growth, % | 0 | -9.43 | 129.27 | 162.56 | 48.55 | 59.78 | 59.78 | 59.78 | 59.78 | 59.78 |
| EBITDA | -9.9 | -7.7 | -40.2 | 55.4 | -42.0 | -84.9 | -135.6 | -216.6 | -346.1 | -553.1 |
| EBITDA, % | -4.99 | -4.25 | -9.71 | 5.1 | -2.61 | -3.29 | -3.29 | -3.29 | -3.29 | -3.29 |
| Depreciation | .9 | 3.0 | 3.6 | 9.4 | 9.3 | 22.8 | 36.5 | 58.3 | 93.1 | 148.7 |
| Depreciation, % | 0.47032 | 1.65 | 0.86244 | 0.8674 | 0.57683 | 0.88502 | 0.88502 | 0.88502 | 0.88502 | 0.88502 |
| EBIT | -10.9 | -10.7 | -43.7 | 46.0 | -51.4 | -107.7 | -172.0 | -274.9 | -439.2 | -701.8 |
| EBIT, % | -5.46 | -5.9 | -10.57 | 4.24 | -3.18 | -4.18 | -4.18 | -4.18 | -4.18 | -4.18 |
| Total Cash | 62.6 | 114.5 | 53.8 | 50.4 | 614.8 | 776.6 | 1,240.8 | 1,982.6 | 3,167.9 | 5,061.7 |
| Total Cash, percent | .0 | .0 | .0 | .0 | .0 | .0 | .0 | .0 | .0 | .0 |
| Account Receivables | .0 | .0 | .0 | .0 | .0 | .0 | .0 | .0 | .0 | .0 |
| Account Receivables, % | 0 | 0 | 0 | 0 | 0 | 0 | 0 | 0 | 0 | 0 |
| Inventories | .0 | .0 | .0 | .0 | .0 | .0 | .0 | .0 | .0 | .0 |
| Inventories, % | 0 | 0 | 0 | 0 | 0 | 0 | 0 | 0 | 0 | 0 |
| Accounts Payable | 16.1 | 16.3 | 149.3 | 239.1 | 284.6 | 478.8 | 765.1 | 1,222.5 | 1,953.3 | 3,121.0 |
| Accounts Payable, % | 8.08 | 9.03 | 36.1 | 22.01 | 17.64 | 18.57 | 18.57 | 18.57 | 18.57 | 18.57 |
| Capital Expenditure | -9.9 | -2.1 | -17.3 | -15.6 | -78.4 | -85.5 | -136.7 | -218.4 | -348.9 | -557.5 |
| Capital Expenditure, % | -4.97 | -1.14 | -4.19 | -1.43 | -4.86 | -3.32 | -3.32 | -3.32 | -3.32 | -3.32 |
| Tax Rate, % | 2.2 | 2.2 | 2.2 | 2.2 | 2.2 | 2.2 | 2.2 | 2.2 | 2.2 | 2.2 |
| EBITAT | -12.6 | -12.8 | -280.7 | 35.9 | -50.2 | -102.4 | -163.7 | -261.5 | -417.9 | -667.7 |
| Depreciation | ||||||||||
| Changes in Account Receivables | ||||||||||
| Changes in Inventories | ||||||||||
| Changes in Accounts Payable | ||||||||||
| Capital Expenditure | ||||||||||
| UFCF | -5.4 | -11.7 | -161.4 | 119.4 | -73.8 | 29.1 | 22.4 | 35.7 | 57.1 | 91.2 |
| WACC, % | 4.67 | 4.67 | 4.67 | 4.67 | 4.67 | 4.67 | 4.67 | 4.67 | 4.67 | 4.67 |
| PV UFCF | ||||||||||
| SUM PV UFCF | 199.5 | |||||||||
| Long Term Growth Rate, % | 3.00 | |||||||||
| Free cash flow (T + 1) | 94 | |||||||||
| Terminal Value | 5,621 | |||||||||
| Present Terminal Value | 4,473 | |||||||||
| Enterprise Value | 4,673 | |||||||||
| Net Debt | -111 | |||||||||
| Equity Value | 4,784 | |||||||||
| Diluted Shares Outstanding, MM | 4,224 | |||||||||
| Equity Value Per Share | 1.13 |
What You Will Receive
- Pre-Filled Financial Model: Central Holding Group Co. Ltd.’s actual data provides accurate DCF valuation.
- Comprehensive Forecast Management: Modify revenue growth, margins, WACC, and other essential drivers.
- Real-Time Calculations: Automatic updates allow you to view results instantly as adjustments are made.
- Professional-Grade Template: A polished Excel file crafted for high-quality valuation presentations.
- Flexible and Repeatable: Designed for customization, enabling frequent use for in-depth forecasts.
Key Features
- 🔍 Real-Life 1735HK Financials: Pre-filled historical and projected data for Central Holding Group Co. Ltd.
- ✏️ Fully Customizable Inputs: Modify all essential parameters (yellow cells) such as WACC, growth %, and tax rates.
- 📊 Professional DCF Valuation: Integrated formulas compute the intrinsic value of Central Holding Group using the Discounted Cash Flow method.
- ⚡ Instant Results: Immediately visualize the valuation of Central Holding Group after making adjustments.
- Scenario Analysis: Explore and compare different outcomes for various financial assumptions side-by-side.
How It Works
- Step 1: Download the prebuilt Excel template featuring Central Holding Group Co. Ltd.'s (1735HK) data.
- Step 2: Navigate through the pre-filled sheets to familiarize yourself with the key metrics.
- Step 3: Modify forecasts and assumptions in the editable yellow cells (WACC, growth, margins).
- Step 4: Instantly view updated results, which include Central Holding Group Co. Ltd.'s (1735HK) intrinsic value.
- Step 5: Utilize the results to make informed investment choices or create reports.
Why Choose Central Holding Group Co. Ltd. (1735HK) Calculator?
- Precision: Utilizes authentic Central Holding financials for reliable data.
- Versatility: Crafted to allow users to experiment and adjust inputs with ease.
- Efficiency: Avoid the complexities of creating a DCF model from the ground up.
- Expert-Grade: Designed with the expertise and usability required by CFOs.
- Intuitive: Simple to navigate, even for those new to financial modeling.
Who Should Consider Central Holding Group Co. Ltd. (1735HK)?
- Investors: Assess the fair value of Central Holding Group Co. Ltd. (1735HK) to make informed investment choices.
- CFOs: Utilize a top-tier DCF model for comprehensive financial reporting and analysis.
- Consultants: Efficiently modify the template for client valuation reports related to Central Holding Group Co. Ltd. (1735HK).
- Entrepreneurs: Discover financial modeling techniques employed by major corporations, including Central Holding Group Co. Ltd. (1735HK).
- Educators: Implement this resource as a teaching aid to illustrate various valuation methodologies.
Contents of the Template
- Preloaded 1735HK Data: Historical and projected financial information, including revenue, EBIT, and capital expenditures.
- DCF and WACC Models: Advanced sheets for determining intrinsic value and Weighted Average Cost of Capital.
- Editable Inputs: Yellow-highlighted cells for modifying revenue growth, tax rates, and discount rates.
- Financial Statements: Detailed annual and quarterly financials for extensive analysis.
- Key Ratios: Ratios related to profitability, leverage, and efficiency for performance assessment.
- Dashboard and Charts: Visual representations of valuation results and underlying assumptions.
Disclaimer
All information, articles, and product details provided on this website are for general informational and educational purposes only. We do not claim any ownership over, nor do we intend to infringe upon, any trademarks, copyrights, logos, brand names, or other intellectual property mentioned or depicted on this site. Such intellectual property remains the property of its respective owners, and any references here are made solely for identification or informational purposes, without implying any affiliation, endorsement, or partnership.
We make no representations or warranties, express or implied, regarding the accuracy, completeness, or suitability of any content or products presented. Nothing on this website should be construed as legal, tax, investment, financial, medical, or other professional advice. In addition, no part of this site—including articles or product references—constitutes a solicitation, recommendation, endorsement, advertisement, or offer to buy or sell any securities, franchises, or other financial instruments, particularly in jurisdictions where such activity would be unlawful.
All content is of a general nature and may not address the specific circumstances of any individual or entity. It is not a substitute for professional advice or services. Any actions you take based on the information provided here are strictly at your own risk. You accept full responsibility for any decisions or outcomes arising from your use of this website and agree to release us from any liability in connection with your use of, or reliance upon, the content or products found herein.