
|
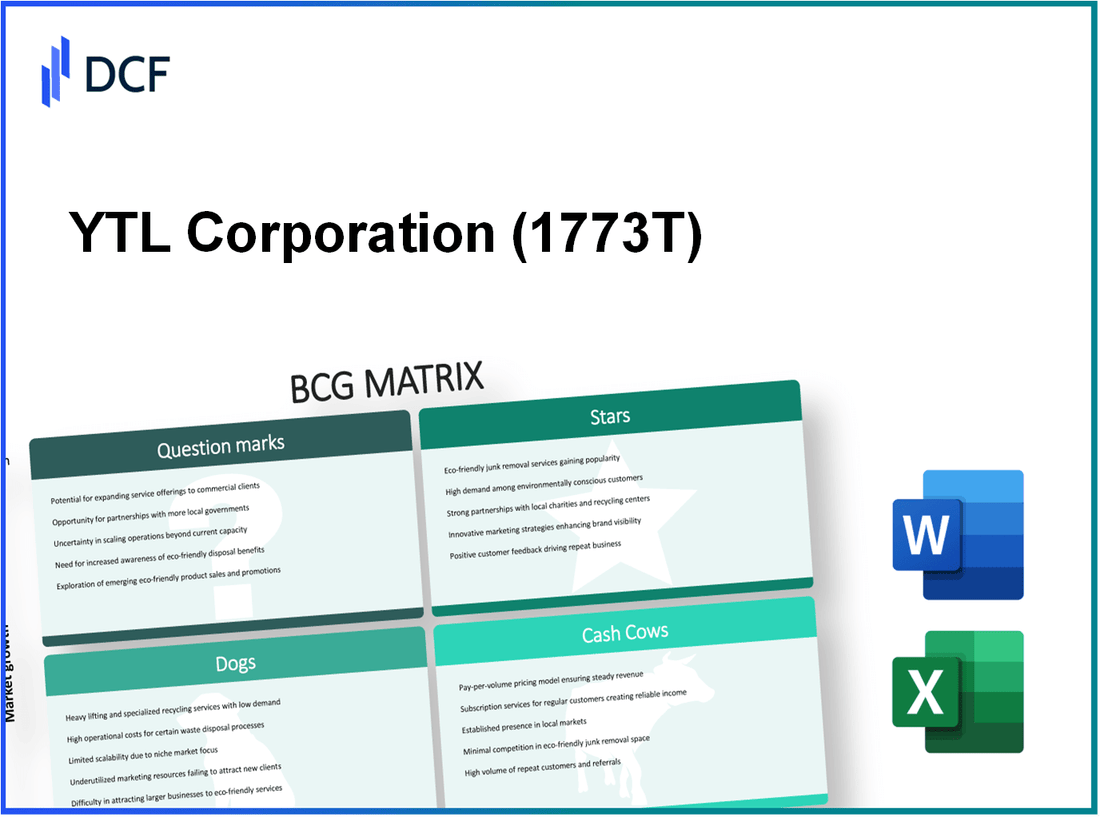
YTL Corporation Berhad (1773.T): BCG Matrix |
Fully Editable: Tailor To Your Needs In Excel Or Sheets
Professional Design: Trusted, Industry-Standard Templates
Investor-Approved Valuation Models
MAC/PC Compatible, Fully Unlocked
No Expertise Is Needed; Easy To Follow
YTL Corporation Berhad (1773.T) Bundle
The Boston Consulting Group (BCG) Matrix is a powerful tool for evaluating a company's portfolio, distinguishing between its stars, cash cows, dogs, and question marks. In the case of YTL Corporation Berhad, each category presents a unique narrative—ranging from high-growth ventures in cement and telecommunications to challenges in the print media sector. Join us as we delve deeper into these classifications, uncovering insights into how YTL navigates its diverse business landscape.
Background of YTL Corporation Berhad
Established in 1955, YTL Corporation Berhad is a leading investment holding company in Malaysia, primarily involved in utilities, construction, property development, and manufacturing. The company is publicly listed on the Bursa Malaysia and has consistently expanded its operations both domestically and internationally.
YTL's core business segments include water and electricity supply, with subsidiaries such as YTL Power International Berhad, which operates power generation and utilities infrastructure. YTL has made significant strides in the telecommunications sector through its subsidiary YTL Communications, which offers 4G services under the brand Yes.
One of YTL's notable projects is the KLIA Ekspres, a high-speed train service that connects Kuala Lumpur International Airport to the city center, enhancing connectivity for travelers. The company has also ventured into property development, with completed projects ranging from luxury resorts to commercial properties, providing a diverse revenue stream.
As of 2023, YTL Corporation reported a revenue of approximately RM 14.3 billion, reflecting a steady growth trajectory despite market fluctuations. The company continues to leverage its diversified portfolio to navigate challenges and seize emerging opportunities.
YTL Corporation Berhad - BCG Matrix: Stars
YTL Corporation Berhad operates in several segments, with certain areas categorized as Stars within the BCG Matrix due to their high market share and growth potential. This analysis focuses on three main areas where YTL demonstrates significant positioning.
High-Growth Cement Segment
The cement segment of YTL Corporation, primarily through its subsidiary YTL Cement Berhad, has reported substantial growth. In FY 2022, YTL Cement recorded a revenue of approximately RM 2.53 billion, representing a growth of 10.5% from the previous fiscal year. With an estimated market share of 30% in Malaysia's cement market, YTL Cement remains a leader.
Further, the overall demand for cement in Malaysia is projected to grow at a CAGR of 5% from 2023 to 2027, driven by infrastructure projects and governmental initiatives.
Advanced Telecommunications Projects
YTL's telecommunications arm, YTL Communications, has made notable strides with its 4G infrastructure and the introduction of the YES 5G network in 2023. This project is projected to generate revenues of approximately RM 1 billion within the next two years, capturing a market segment with a potential expansion rate of 15% annually.
YTL Communications currently holds a market share of around 15% in the telecommunications sector, competing vigorously against established players and leveraging its first-mover advantages in the wireless broadband market.
Renewable Energy Initiatives
YTL Corporation has made significant investments in renewable energy, focusing on solar and hydroelectric power. In 2023, the company's renewable energy projects contributed to a total capacity of 1,000 MW, with expected revenue growth of 20% year-on-year. With an increasing demand for sustainable energy solutions, YTL aims to expand its market share from 10% to 25% by 2025.
The table below summarizes the financial performance and growth potential of YTL's Star segments:
| Segment | Revenue (FY 2022) | Market Share | Projected CAGR (2023-2027) | Key Initiatives |
|---|---|---|---|---|
| Cement | RM 2.53 billion | 30% | 5% | Infrastructure projects, expansion in local markets |
| Telecommunications | RM 1 billion (projected) | 15% | 15% | YES 5G network rollout, broadband expansion |
| Renewable Energy | Growing revenues with 20% YoY | 10% (targeting 25% by 2025) | 20% | Solar and hydroelectric projects, sustainability initiatives |
Through strategic investments and leveraging existing market strengths, YTL Corporation's Stars are poised for continued growth, reflecting a robust business model that capitalizes on high-demand sectors.
YTL Corporation Berhad - BCG Matrix: Cash Cows
The mature utilities business of YTL Corporation Berhad has established itself as a reliable cash cow. As one of Malaysia's leading utility providers, YTL’s subsidiary, YTL Power International Berhad, recorded a revenue of RM 13.1 billion in the fiscal year 2022, with an operating profit margin exceeding 20%. The stable demand for electricity and water services contributes to consistent cash inflows, allowing the company to maintain a solid financial footing.
The construction division of YTL Corporation also performs steadily, contributing significantly to the overall profitability. For the financial year ending 2022, YTL’s construction segment generated revenues of approximately RM 3.5 billion with a net profit margin of around 10%. This division has benefited from ongoing infrastructure projects in Malaysia, especially with initiatives related to the government’s economic recovery plans.
The established property development sector of YTL Corporation further solidifies its status as a cash cow. Within the fiscal year 2022, this segment recorded sales of RM 2.2 billion. The operating profit margin for property development stood at around 15%, driven by a diverse portfolio that includes residential, commercial, and hospitality projects. This segment has consistently delivered strong cash flow, allowing YTL to reinvest in other strategic initiatives.
| Business Segment | Fiscal Year 2022 Revenue (RM) | Profit Margin (%) |
|---|---|---|
| Mature Utilities Business | 13.1 billion | 20 |
| Construction Division | 3.5 billion | 10 |
| Property Development Sector | 2.2 billion | 15 |
YTL Corporation's strategic approach to its cash cows has enabled the company to harness significant cash flow to fund various operations. The consistent profitability from these segments allows the corporation to sustain investments in Question Mark segments and other growth areas, ensuring a balanced and robust portfolio.
YTL Corporation Berhad - BCG Matrix: Dogs
YTL Corporation Berhad has segments within its business categorized as 'Dogs,' reflecting low growth and low market share. These segments require significant scrutiny due to their potential to drain resources without delivering adequate returns.
Declining Print Media Investments
The print media segment has faced considerable challenges in recent years, driven by a shift towards digital media consumption. In the fiscal year 2022, YTL’s print media division reported revenues of MYR 70 million, a decline of approximately 15% year-over-year. This downturn reflects broader industry trends where print advertising revenue has decreased, leading to diminished market share.
| Year | Revenue (MYR) | Year-over-Year Growth (%) |
|---|---|---|
| 2020 | MYR 100 million | - |
| 2021 | MYR 82 million | -18% |
| 2022 | MYR 70 million | -15% |
Continued declines highlight the segment's positioning as a 'Dog,' with efforts to revitalize it resulting in high costs against marginal returns.
Underperforming Retail Segment
YTL’s retail division, which encompasses a range of shopping centers and retail outlets, is another area identified as a Dog. In 2022, the segment recorded revenues of MYR 220 million, a stark reduction from MYR 300 million in 2021. The ongoing challenges in attracting foot traffic post-pandemic have severely impacted overall performance.
| Year | Revenue (MYR) | Market Share (%) |
|---|---|---|
| 2020 | MYR 250 million | 15% |
| 2021 | MYR 300 million | 12% |
| 2022 | MYR 220 million | 9% |
The retail segment’s market share has eroded significantly, contributing to its classification as a cash trap, with minimal cash generation compared to investment costs.
Legacy Transportation Services
The transportation services segment, particularly the rail division, has been characterized by stagnant growth and limited market share. YTL's rail operations reported revenues of MYR 150 million in 2022, with only a 2% growth compared to the previous year, reflecting a broader decline in the sector.
| Year | Revenue (MYR) | Growth Rate (%) |
|---|---|---|
| 2020 | MYR 160 million | - |
| 2021 | MYR 147 million | -8% |
| 2022 | MYR 150 million | 2% |
With limited innovation and increasing competition from other transportation modes, this segment has not captured the necessary growth to justify continued investment.
YTL Corporation Berhad - BCG Matrix: Question Marks
YTL Corporation Berhad, a significant player in various sectors, must navigate its portfolio carefully, particularly in identifying its Question Marks. These units represent high growth potential but currently hold low market shares, necessitating a strategic focus to either invest significantly to increase market share or divest. Below is an analysis of specific areas within YTL's operations that fall into the Question Marks category.
Emerging Technology Ventures
YTL has ventured into emerging technologies, particularly in renewable energy and digital innovations. One of its initiatives includes the development of solar energy projects. As of the latest updates, YTL's investment in renewable energy is expected to reach RM 2 billion by 2025, although its current market share in the renewable energy sector is estimated at 5%, reflecting its position as a Question Mark.
New Geographical Market Entries
YTL's expansion into new geographical markets, particularly in Southeast Asia, has shown promise yet remains underdeveloped. The company reported a 20% growth in revenue from its international segments in FY 2022, amounting to approximately RM 1.5 billion. However, their market share in these regions remains low, averaging around 10% across new entries, indicating potential growth that has yet to be fully realized.
Uncertain Hospitality Engagements
In the hospitality sector, YTL operates several hotels and resorts that have entered new markets. The segment reported a 15% increase in guest bookings in FY 2023, driven largely by digital marketing efforts. However, with an overall market share of only 8% in these new hospitality markets, these operations qualify as Question Marks. The potential revenue from these engagements is projected at RM 300 million, but their current profitability is low, with an operating margin of just 4%.
| Segment | Investment (RM) | Market Share (%) | Revenue FY 2022 (RM) | Growth Rate (%) | Operating Margin (%) |
|---|---|---|---|---|---|
| Emerging Technology Ventures | 2,000,000,000 | 5 | Data not applicable | Data not applicable | Data not applicable |
| New Geographical Market Entries | Data not applicable | 10 | 1,500,000,000 | 20 | Data not applicable |
| Uncertain Hospitality Engagements | Data not applicable | 8 | Data not applicable | 15 | 4 |
Overall, YTL Corporation must carefully assess these Question Marks, weighing the potential for growth against the financial burden they currently impose. The strategic decision will influence whether these ventures can evolve into Stars or become liabilities if not properly managed.
The BCG Matrix provides insightful clarity into YTL Corporation Berhad's diverse portfolio, illuminating its strengths and weaknesses across various sectors. With robust growth in its Stars, reliable revenues from Cash Cows, challenges in Dogs, and potential in Question Marks, it becomes clear that strategic decision-making will be vital for navigating the company's future and maximizing shareholder value.
[right_small]Disclaimer
All information, articles, and product details provided on this website are for general informational and educational purposes only. We do not claim any ownership over, nor do we intend to infringe upon, any trademarks, copyrights, logos, brand names, or other intellectual property mentioned or depicted on this site. Such intellectual property remains the property of its respective owners, and any references here are made solely for identification or informational purposes, without implying any affiliation, endorsement, or partnership.
We make no representations or warranties, express or implied, regarding the accuracy, completeness, or suitability of any content or products presented. Nothing on this website should be construed as legal, tax, investment, financial, medical, or other professional advice. In addition, no part of this site—including articles or product references—constitutes a solicitation, recommendation, endorsement, advertisement, or offer to buy or sell any securities, franchises, or other financial instruments, particularly in jurisdictions where such activity would be unlawful.
All content is of a general nature and may not address the specific circumstances of any individual or entity. It is not a substitute for professional advice or services. Any actions you take based on the information provided here are strictly at your own risk. You accept full responsibility for any decisions or outcomes arising from your use of this website and agree to release us from any liability in connection with your use of, or reliance upon, the content or products found herein.