
|
China Coal Energy Company Limited (1898.HK) DCF Valuation |
Fully Editable: Tailor To Your Needs In Excel Or Sheets
Professional Design: Trusted, Industry-Standard Templates
Investor-Approved Valuation Models
MAC/PC Compatible, Fully Unlocked
No Expertise Is Needed; Easy To Follow
China Coal Energy Company Limited (1898.HK) Bundle
Enhance your investment choices with the China Coal Energy Company Limited (1898HK) DCF Calculator! Review genuine financial data, adjust growth projections and expenses, and instantly observe how these alterations affect the intrinsic value of China Coal Energy Company Limited (1898HK).
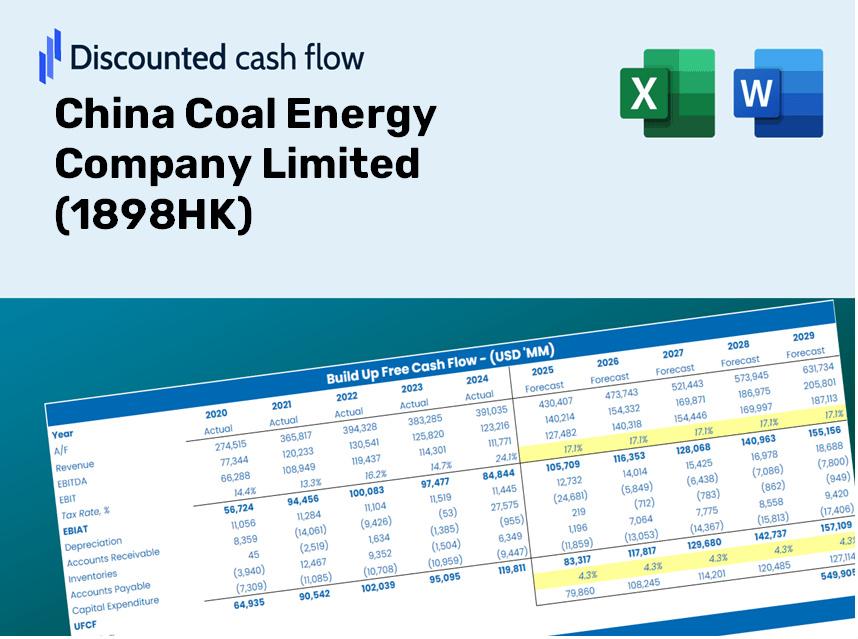
Discounted Cash Flow (DCF) - (USD MM)
| Year | AY1 2020 |
AY2 2021 |
AY3 2022 |
AY4 2023 |
AY5 2024 |
FY1 2025 |
FY2 2026 |
FY3 2027 |
FY4 2028 |
FY5 2029 |
|---|---|---|---|---|---|---|---|---|---|---|
| Revenue | 154,478.1 | 262,825.7 | 241,728.1 | 211,472.7 | 199,350.7 | 221,210.6 | 245,467.5 | 272,384.3 | 302,252.7 | 335,396.3 |
| Revenue Growth, % | 0 | 70.14 | -8.03 | -12.52 | -5.73 | 10.97 | 10.97 | 10.97 | 10.97 | 10.97 |
| EBITDA | 28,098.8 | 44,392.7 | 56,048.2 | 48,546.4 | 47,449.5 | 46,465.2 | 51,560.4 | 57,214.3 | 63,488.1 | 70,449.9 |
| EBITDA, % | 18.19 | 16.89 | 23.19 | 22.96 | 23.8 | 21 | 21 | 21 | 21 | 21 |
| Depreciation | 10,901.6 | 11,770.3 | 11,537.6 | 12,317.4 | 11,431.9 | 12,329.2 | 13,681.1 | 15,181.3 | 16,846.0 | 18,693.3 |
| Depreciation, % | 7.06 | 4.48 | 4.77 | 5.82 | 5.73 | 5.57 | 5.57 | 5.57 | 5.57 | 5.57 |
| EBIT | 17,197.2 | 32,622.4 | 44,510.6 | 36,229.1 | 36,017.6 | 34,136.1 | 37,879.3 | 42,032.9 | 46,642.0 | 51,756.6 |
| EBIT, % | 11.13 | 12.41 | 18.41 | 17.13 | 18.07 | 15.43 | 15.43 | 15.43 | 15.43 | 15.43 |
| Total Cash | 39,396.0 | 79,917.4 | 99,754.0 | 100,320.8 | 84,138.8 | 82,654.1 | 91,717.6 | 101,774.9 | 112,935.1 | 125,319.0 |
| Total Cash, percent | .0 | .0 | .0 | .0 | .0 | .0 | .0 | .0 | .0 | .0 |
| Account Receivables | 17,971.3 | 20,295.3 | 22,866.3 | 14,398.7 | 15,981.3 | 19,307.5 | 21,424.7 | 23,774.0 | 26,380.9 | 29,273.8 |
| Account Receivables, % | 11.63 | 7.72 | 9.46 | 6.81 | 8.02 | 8.73 | 8.73 | 8.73 | 8.73 | 8.73 |
| Inventories | 7,726.3 | 9,120.9 | 10,246.6 | 9,572.6 | 8,485.9 | 9,509.5 | 10,552.2 | 11,709.3 | 12,993.3 | 14,418.1 |
| Inventories, % | 5 | 3.47 | 4.24 | 4.53 | 4.26 | 4.3 | 4.3 | 4.3 | 4.3 | 4.3 |
| Accounts Payable | 23,441.4 | 22,743.0 | 20,632.7 | 29,301.8 | 29,633.6 | 27,025.1 | 29,988.5 | 33,276.9 | 36,925.9 | 40,975.0 |
| Accounts Payable, % | 15.17 | 8.65 | 8.54 | 13.86 | 14.87 | 12.22 | 12.22 | 12.22 | 12.22 | 12.22 |
| Capital Expenditure | -11,295.7 | -11,427.2 | -10,691.8 | -19,260.2 | -19,803.3 | -15,539.9 | -17,243.9 | -19,134.8 | -21,233.0 | -23,561.3 |
| Capital Expenditure, % | -7.31 | -4.35 | -4.42 | -9.11 | -9.93 | -7.02 | -7.02 | -7.02 | -7.02 | -7.02 |
| Tax Rate, % | 40.11 | 40.11 | 40.11 | 40.11 | 40.11 | 40.11 | 40.11 | 40.11 | 40.11 | 40.11 |
| EBITAT | 8,242.6 | 17,191.8 | 24,704.9 | 21,413.8 | 21,570.3 | 18,783.5 | 20,843.2 | 23,128.8 | 25,665.0 | 28,479.3 |
| Depreciation | ||||||||||
| Changes in Account Receivables | ||||||||||
| Changes in Inventories | ||||||||||
| Changes in Accounts Payable | ||||||||||
| Capital Expenditure | ||||||||||
| UFCF | 5,592.2 | 13,118.0 | 19,743.6 | 32,281.7 | 13,034.9 | 8,614.5 | 17,084.0 | 18,957.3 | 21,036.1 | 23,342.8 |
| WACC, % | 4.64 | 4.7 | 4.73 | 4.78 | 4.78 | 4.72 | 4.72 | 4.72 | 4.72 | 4.72 |
| PV UFCF | ||||||||||
| SUM PV UFCF | 76,328.8 | |||||||||
| Long Term Growth Rate, % | 2.00 | |||||||||
| Free cash flow (T + 1) | 23,810 | |||||||||
| Terminal Value | 873,803 | |||||||||
| Present Terminal Value | 693,690 | |||||||||
| Enterprise Value | 770,019 | |||||||||
| Net Debt | 37,884 | |||||||||
| Equity Value | 732,135 | |||||||||
| Diluted Shares Outstanding, MM | 13,259 | |||||||||
| Equity Value Per Share | 55.22 |
What You Will Receive
- Pre-Populated Financial Model: Utilize China Coal Energy Company Limited’s actual data for accurate DCF valuations.
- Comprehensive Forecasting Control: Modify revenue growth, profit margins, WACC, and other essential drivers.
- Real-Time Calculations: Automatic adjustments allow you to view results instantly as changes are made.
- Professional-Grade Template: A polished Excel file crafted for high-quality valuation analysis.
- Flexible and Reusable: Designed for adaptability, making it suitable for ongoing detailed forecasts.
Key Features
- Authentic China Coal Financials: Gain access to precise pre-loaded historical data and future forecasts.
- Adjustable Forecast Parameters: Modify the highlighted cells for WACC, growth rates, and profit margins.
- Real-Time Calculations: Automatic updates for DCF, Net Present Value (NPV), and cash flow assessments.
- Interactive Dashboard: User-friendly charts and summaries to easily visualize your valuation outcomes.
- Suitable for All Levels: An intuitive layout designed for investors, CFOs, and consultants alike.
How It Works
- Step 1: Download the Excel file.
- Step 2: Review China Coal Energy Company Limited’s (1898HK) pre-filled financial data and forecasts.
- Step 3: Adjust key inputs such as revenue growth, WACC, and tax rates (highlighted cells).
- Step 4: Observe the DCF model update in real-time as you modify your assumptions.
- Step 5: Evaluate the outcomes and leverage the results for your investment strategies.
Why Opt for This Calculator?
- All-in-One Solution: Features DCF, WACC, and financial ratio analyses all in a single platform.
- Flexible Inputs: Modify the yellow-highlighted cells to explore different scenarios.
- In-depth Analysis: Automatically computes the intrinsic value and Net Present Value for China Coal Energy Company Limited (1898HK).
- Prepopulated Information: Historical and projected data provide a solid foundation for calculations.
- High-Quality Standards: Perfect for financial analysts, investors, and business advisors.
Who Can Benefit from This Product?
- Institutional Investors: Develop comprehensive and trustworthy valuation models for assessing investments in China Coal Energy Company Limited (1898HK).
- Corporate Finance Departments: Evaluate valuation scenarios to inform strategic planning within the organization.
- Financial Advisors and Consultants: Equip clients with precise valuation analyses for China Coal Energy Company Limited (1898HK) stock.
- Academics and Students: Utilize live data for practicing and teaching financial analysis techniques.
- Market Analysts: Gain insights into how companies like China Coal Energy Company Limited (1898HK) are appraised in the marketplace.
Contents of the Template
- Pre-Filled Data: Contains historical financials and projections for China Coal Energy Company Limited (1898HK).
- Discounted Cash Flow Model: Interactive DCF valuation model featuring automatic calculations.
- Weighted Average Cost of Capital (WACC): A specific sheet designed for calculating WACC using user-defined inputs.
- Key Financial Ratios: Evaluate the profitability, efficiency, and leverage of China Coal Energy Company Limited (1898HK).
- Customizable Inputs: Easily adjust revenue growth, profit margins, and tax rates.
- Comprehensive Dashboard: Graphs and tables that summarize essential valuation outcomes.
Disclaimer
All information, articles, and product details provided on this website are for general informational and educational purposes only. We do not claim any ownership over, nor do we intend to infringe upon, any trademarks, copyrights, logos, brand names, or other intellectual property mentioned or depicted on this site. Such intellectual property remains the property of its respective owners, and any references here are made solely for identification or informational purposes, without implying any affiliation, endorsement, or partnership.
We make no representations or warranties, express or implied, regarding the accuracy, completeness, or suitability of any content or products presented. Nothing on this website should be construed as legal, tax, investment, financial, medical, or other professional advice. In addition, no part of this site—including articles or product references—constitutes a solicitation, recommendation, endorsement, advertisement, or offer to buy or sell any securities, franchises, or other financial instruments, particularly in jurisdictions where such activity would be unlawful.
All content is of a general nature and may not address the specific circumstances of any individual or entity. It is not a substitute for professional advice or services. Any actions you take based on the information provided here are strictly at your own risk. You accept full responsibility for any decisions or outcomes arising from your use of this website and agree to release us from any liability in connection with your use of, or reliance upon, the content or products found herein.