
|
Chow Tai Fook Jewellery Group Limited (1929.HK) DCF Valuation |
Fully Editable: Tailor To Your Needs In Excel Or Sheets
Professional Design: Trusted, Industry-Standard Templates
Investor-Approved Valuation Models
MAC/PC Compatible, Fully Unlocked
No Expertise Is Needed; Easy To Follow
Chow Tai Fook Jewellery Group Limited (1929.HK) Bundle
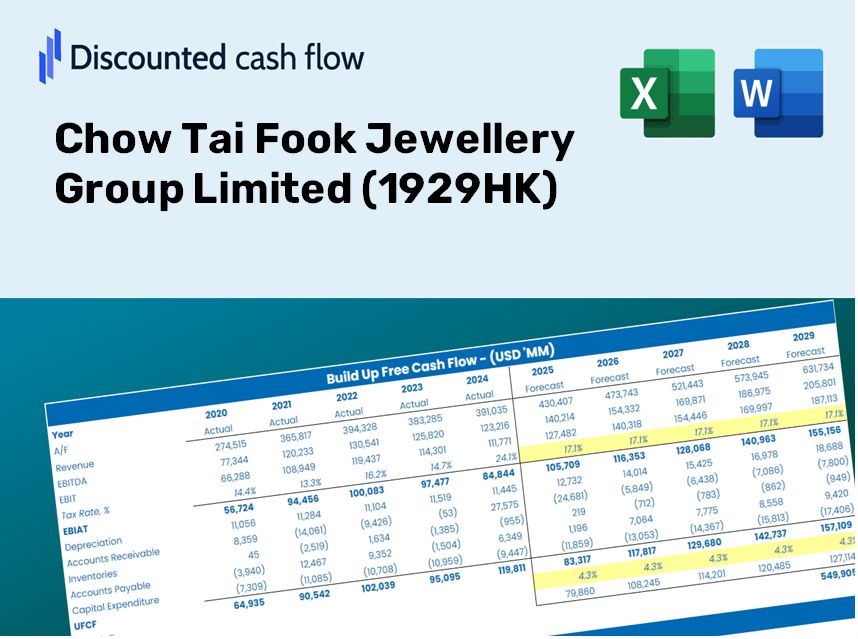
Enhance your valuation analysis of Chow Tai Fook Jewellery Group Limited (1929HK) with our sophisticated DCF Calculator! This Excel template comes preloaded with accurate (1929HK) data, enabling you to adjust forecasts and assumptions to determine the intrinsic value of Chow Tai Fook Jewellery Group Limited with precision.
Discounted Cash Flow (DCF) - (USD MM)
| Year | AY1 2021 |
AY2 2022 |
AY3 2023 |
AY4 2024 |
AY5 2025 |
FY1 2026 |
FY2 2027 |
FY3 2028 |
FY4 2029 |
FY5 2030 |
|---|---|---|---|---|---|---|---|---|---|---|
| Revenue | 70,163.8 | 98,937.7 | 94,684.4 | 108,713.0 | 89,656.0 | 97,276.1 | 105,543.9 | 114,514.4 | 124,247.3 | 134,807.4 |
| Revenue Growth, % | 0 | 41.01 | -4.3 | 14.82 | -17.53 | 8.5 | 8.5 | 8.5 | 8.5 | 8.5 |
| EBITDA | 10,873.2 | 11,328.6 | 10,232.1 | 11,712.4 | 10,613.0 | 11,744.1 | 12,742.3 | 13,825.3 | 15,000.3 | 16,275.2 |
| EBITDA, % | 15.5 | 11.45 | 10.81 | 10.77 | 11.84 | 12.07 | 12.07 | 12.07 | 12.07 | 12.07 |
| Depreciation | 2,107.2 | 2,013.7 | 2,200.5 | 2,259.6 | 2,102.9 | 2,293.1 | 2,488.0 | 2,699.5 | 2,928.9 | 3,177.9 |
| Depreciation, % | 3 | 2.04 | 2.32 | 2.08 | 2.35 | 2.36 | 2.36 | 2.36 | 2.36 | 2.36 |
| EBIT | 8,766.0 | 9,314.9 | 8,031.6 | 9,452.8 | 8,510.1 | 9,451.0 | 10,254.3 | 11,125.8 | 12,071.4 | 13,097.4 |
| EBIT, % | 12.49 | 9.41 | 8.48 | 8.7 | 9.49 | 9.72 | 9.72 | 9.72 | 9.72 | 9.72 |
| Total Cash | 6,031.9 | 14,942.2 | 11,733.8 | 7,695.4 | 7,582.4 | 10,044.3 | 10,898.0 | 11,824.3 | 12,829.3 | 13,919.7 |
| Total Cash, percent | .0 | .0 | .0 | .0 | .0 | .0 | .0 | .0 | .0 | .0 |
| Account Receivables | 4,435.9 | 3,189.8 | 3,315.4 | 3,045.8 | 2,316.2 | 3,586.2 | 3,891.0 | 4,221.7 | 4,580.5 | 4,969.8 |
| Account Receivables, % | 6.32 | 3.22 | 3.5 | 2.8 | 2.58 | 3.69 | 3.69 | 3.69 | 3.69 | 3.69 |
| Inventories | 43,224.6 | 57,488.5 | 59,290.4 | 64,647.0 | 55,417.2 | 59,067.4 | 64,087.7 | 69,534.7 | 75,444.6 | 81,856.9 |
| Inventories, % | 61.61 | 58.11 | 62.62 | 59.47 | 61.81 | 60.72 | 60.72 | 60.72 | 60.72 | 60.72 |
| Accounts Payable | 819.4 | 1,155.1 | 992.6 | 1,041.2 | 1,128.8 | 1,089.6 | 1,182.2 | 1,282.7 | 1,391.7 | 1,510.0 |
| Accounts Payable, % | 1.17 | 1.17 | 1.05 | 0.95775 | 1.26 | 1.12 | 1.12 | 1.12 | 1.12 | 1.12 |
| Capital Expenditure | -839.3 | -1,530.7 | -1,981.6 | -963.2 | -577.9 | -1,238.7 | -1,343.9 | -1,458.2 | -1,582.1 | -1,716.6 |
| Capital Expenditure, % | -1.2 | -1.55 | -2.09 | -0.886 | -0.64457 | -1.27 | -1.27 | -1.27 | -1.27 | -1.27 |
| Tax Rate, % | 25.28 | 25.28 | 25.28 | 25.28 | 25.28 | 25.28 | 25.28 | 25.28 | 25.28 | 25.28 |
| EBITAT | 6,296.5 | 6,964.8 | 5,807.7 | 7,038.8 | 6,358.4 | 6,957.6 | 7,548.9 | 8,190.5 | 8,886.7 | 9,642.0 |
| Depreciation | ||||||||||
| Changes in Account Receivables | ||||||||||
| Changes in Inventories | ||||||||||
| Changes in Accounts Payable | ||||||||||
| Capital Expenditure | ||||||||||
| UFCF | -39,276.7 | -5,234.3 | 3,936.6 | 3,296.8 | 17,930.4 | 3,052.7 | 3,460.5 | 3,754.6 | 4,073.7 | 4,420.0 |
| WACC, % | 6.3 | 6.31 | 6.3 | 6.31 | 6.31 | 6.3 | 6.3 | 6.3 | 6.3 | 6.3 |
| PV UFCF | ||||||||||
| SUM PV UFCF | 15,505.4 | |||||||||
| Long Term Growth Rate, % | 3.00 | |||||||||
| Free cash flow (T + 1) | 4,553 | |||||||||
| Terminal Value | 137,794 | |||||||||
| Present Terminal Value | 101,504 | |||||||||
| Enterprise Value | 117,009 | |||||||||
| Net Debt | 13,207 | |||||||||
| Equity Value | 103,803 | |||||||||
| Diluted Shares Outstanding, MM | 9,988 | |||||||||
| Equity Value Per Share | 10.39 |
What You Will Receive
- Authentic 1929HK Financials: Contains both historical and projected data for precise valuation.
- Customizable Inputs: Adjust WACC, tax rates, revenue growth, and capital expenditures as needed.
- Real-Time Calculations: Intrinsic value and NPV are computed automatically and on-the-fly.
- Scenario Analysis: Explore various scenarios to assess Chow Tai Fook’s potential future performance.
- User-Friendly Design: Crafted for professionals while remaining approachable for newcomers.
Key Features
- Customizable Forecast Inputs: Adjust essential factors such as sales growth, profit margins, and investment expenses.
- Instant DCF Valuation: Quickly computes intrinsic value, net present value (NPV), and additional financial metrics.
- High-Precision Accuracy: Relies on Chow Tai Fook’s actual financial performance for dependable valuation results.
- Streamlined Scenario Analysis: Effortlessly evaluate various assumptions and analyze different outcomes.
- Efficiency Booster: Remove the hassle of constructing intricate valuation models from the ground up.
How It Works
- Step 1: Download the Excel file.
- Step 2: Review pre-filled Chow Tai Fook data (historical and projected).
- Step 3: Modify key assumptions (yellow cells) according to your analysis.
- Step 4: Observe automatic recalculations for Chow Tai Fook’s intrinsic value.
- Step 5: Utilize the outputs for investment choices or reporting.
Why Choose This Calculator for Chow Tai Fook Jewellery Group Limited (1929HK)?
- User-Friendly Interface: Perfectly crafted for both novices and seasoned users.
- Customizable Parameters: Adjust the inputs effortlessly to suit your analytical needs.
- Real-Time Feedback: Watch Chow Tai Fook's valuation update instantly as you modify inputs.
- Pre-Loaded Data: Comes equipped with Chow Tai Fook's actual financial figures for quick assessments.
- Preferred by Experts: A go-to tool for investors and analysts aiming for sound decision-making.
Who Can Benefit from This Product?
- Individual Investors: Gain insights to make informed decisions about buying or selling Chow Tai Fook Jewellery Group Limited (1929HK) shares.
- Financial Analysts: Enhance valuation methodologies with comprehensive financial models tailored to Chow Tai Fook (1929HK).
- Consultants: Provide clients with accurate and timely valuation insights related to Chow Tai Fook Jewellery Group (1929HK).
- Business Owners: Learn how industry leaders like Chow Tai Fook (1929HK) are valued to inform your own business strategy.
- Finance Students: Master valuation techniques through the analysis of Chow Tai Fook (1929HK) and its real-world applications.
Contents of the Template
- Pre-Filled Data: Features Chow Tai Fook Jewellery Group Limited’s historical financials and forecasts.
- Discounted Cash Flow Model: An editable DCF valuation model with automatic calculations.
- Weighted Average Cost of Capital (WACC): A dedicated sheet for WACC calculations based on custom inputs.
- Key Financial Ratios: Evaluate Chow Tai Fook's profitability, efficiency, and leverage metrics.
- Customizable Inputs: Easily edit parameters such as revenue growth, margins, and tax rates.
- Clear Dashboard: Visuals and tables summarizing essential valuation outcomes.
Disclaimer
All information, articles, and product details provided on this website are for general informational and educational purposes only. We do not claim any ownership over, nor do we intend to infringe upon, any trademarks, copyrights, logos, brand names, or other intellectual property mentioned or depicted on this site. Such intellectual property remains the property of its respective owners, and any references here are made solely for identification or informational purposes, without implying any affiliation, endorsement, or partnership.
We make no representations or warranties, express or implied, regarding the accuracy, completeness, or suitability of any content or products presented. Nothing on this website should be construed as legal, tax, investment, financial, medical, or other professional advice. In addition, no part of this site—including articles or product references—constitutes a solicitation, recommendation, endorsement, advertisement, or offer to buy or sell any securities, franchises, or other financial instruments, particularly in jurisdictions where such activity would be unlawful.
All content is of a general nature and may not address the specific circumstances of any individual or entity. It is not a substitute for professional advice or services. Any actions you take based on the information provided here are strictly at your own risk. You accept full responsibility for any decisions or outcomes arising from your use of this website and agree to release us from any liability in connection with your use of, or reliance upon, the content or products found herein.