
|
Kyudenko Corporation (1959.T) DCF Valuation |
Fully Editable: Tailor To Your Needs In Excel Or Sheets
Professional Design: Trusted, Industry-Standard Templates
Investor-Approved Valuation Models
MAC/PC Compatible, Fully Unlocked
No Expertise Is Needed; Easy To Follow
Kyudenko Corporation (1959.T) Bundle
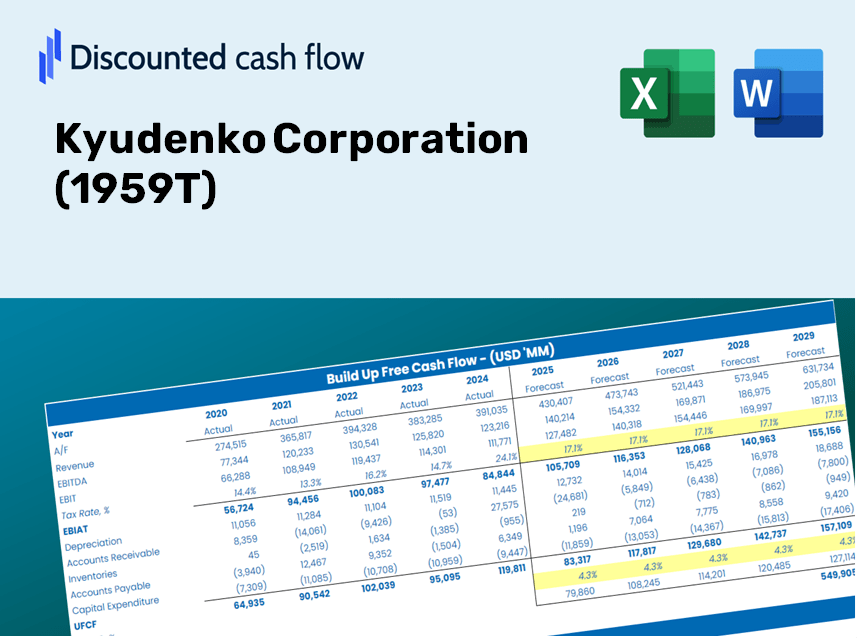
Gain mastery over your Kyudenko Corporation (1959T) valuation analysis with our sophisticated DCF Calculator! This Excel template comes preloaded with real (1959T) data, enabling you to adjust forecasts and assumptions to accurately determine the intrinsic value of Kyudenko Corporation.
Discounted Cash Flow (DCF) - (USD MM)
| Year | AY1 2020 |
AY2 2021 |
AY3 2022 |
AY4 2023 |
AY5 2024 |
FY1 2025 |
FY2 2026 |
FY3 2027 |
FY4 2028 |
FY5 2029 |
|---|---|---|---|---|---|---|---|---|---|---|
| Revenue | 391,901.0 | 376,563.0 | 395,783.0 | 469,057.0 | 473,954.0 | 498,538.0 | 524,397.2 | 551,597.7 | 580,209.0 | 610,304.5 |
| Revenue Growth, % | 0 | -3.91 | 5.1 | 18.51 | 1.04 | 5.19 | 5.19 | 5.19 | 5.19 | 5.19 |
| EBITDA | 43,039.0 | 43,117.0 | 45,573.0 | 47,911.0 | 51,531.0 | 54,872.9 | 57,719.1 | 60,713.0 | 63,862.2 | 67,174.7 |
| EBITDA, % | 10.98 | 11.45 | 11.51 | 10.21 | 10.87 | 11.01 | 11.01 | 11.01 | 11.01 | 11.01 |
| Depreciation | 5,845.0 | 5,898.0 | 6,355.0 | 6,286.0 | 6,722.0 | 7,400.1 | 7,784.0 | 8,187.7 | 8,612.4 | 9,059.1 |
| Depreciation, % | 1.49 | 1.57 | 1.61 | 1.34 | 1.42 | 1.48 | 1.48 | 1.48 | 1.48 | 1.48 |
| EBIT | 37,194.0 | 37,219.0 | 39,218.0 | 41,625.0 | 44,809.0 | 47,472.8 | 49,935.2 | 52,525.3 | 55,249.8 | 58,115.6 |
| EBIT, % | 9.49 | 9.88 | 9.91 | 8.87 | 9.45 | 9.52 | 9.52 | 9.52 | 9.52 | 9.52 |
| Total Cash | 50,905.0 | 40,008.0 | 67,534.0 | 98,548.0 | 71,697.0 | 76,589.8 | 80,562.5 | 84,741.3 | 89,136.8 | 93,760.3 |
| Total Cash, percent | .0 | .0 | .0 | .0 | .0 | .0 | .0 | .0 | .0 | .0 |
| Account Receivables | 130,687.0 | 136,642.0 | 148,899.0 | 164,887.0 | 163,206.0 | 176,325.7 | 185,471.7 | 195,092.1 | 205,211.6 | 215,855.9 |
| Account Receivables, % | 33.35 | 36.29 | 37.62 | 35.15 | 34.43 | 35.37 | 35.37 | 35.37 | 35.37 | 35.37 |
| Inventories | 21,529.0 | 29,489.0 | 39,995.0 | 43,922.0 | 46,689.0 | 42,520.0 | 44,725.5 | 47,045.4 | 49,485.7 | 52,052.5 |
| Inventories, % | 5.49 | 7.83 | 10.11 | 9.36 | 9.85 | 8.53 | 8.53 | 8.53 | 8.53 | 8.53 |
| Accounts Payable | 63,559.0 | 66,669.0 | 69,832.0 | 119,498.0 | 90,584.0 | 95,874.2 | 100,847.2 | 106,078.2 | 111,580.4 | 117,368.1 |
| Accounts Payable, % | 16.22 | 17.7 | 17.64 | 25.48 | 19.11 | 19.23 | 19.23 | 19.23 | 19.23 | 19.23 |
| Capital Expenditure | -2,949.0 | -4,141.0 | -3,066.0 | -2,018.0 | -3,852.0 | -3,858.5 | -4,058.6 | -4,269.1 | -4,490.6 | -4,723.5 |
| Capital Expenditure, % | -0.75249 | -1.1 | -0.77467 | -0.43022 | -0.81274 | -0.77396 | -0.77396 | -0.77396 | -0.77396 | -0.77396 |
| Tax Rate, % | 34.79 | 34.79 | 34.79 | 34.79 | 34.79 | 34.79 | 34.79 | 34.79 | 34.79 | 34.79 |
| EBITAT | 25,321.1 | 26,490.7 | 26,637.7 | 28,334.9 | 29,220.5 | 32,325.0 | 34,001.7 | 35,765.4 | 37,620.6 | 39,572.0 |
| Depreciation | ||||||||||
| Changes in Account Receivables | ||||||||||
| Changes in Inventories | ||||||||||
| Changes in Accounts Payable | ||||||||||
| Capital Expenditure | ||||||||||
| UFCF | -60,439.9 | 17,442.7 | 10,326.7 | 62,353.9 | 2,090.5 | 32,206.2 | 31,348.5 | 32,974.6 | 34,685.0 | 36,484.1 |
| WACC, % | 6.22 | 6.22 | 6.22 | 6.22 | 6.22 | 6.22 | 6.22 | 6.22 | 6.22 | 6.22 |
| PV UFCF | ||||||||||
| SUM PV UFCF | 139,848.9 | |||||||||
| Long Term Growth Rate, % | 2.00 | |||||||||
| Free cash flow (T + 1) | 37,214 | |||||||||
| Terminal Value | 881,889 | |||||||||
| Present Terminal Value | 652,209 | |||||||||
| Enterprise Value | 792,058 | |||||||||
| Net Debt | -49,219 | |||||||||
| Equity Value | 841,277 | |||||||||
| Diluted Shares Outstanding, MM | 71 | |||||||||
| Equity Value Per Share | 11,894.13 |
What You Will Receive
- Authentic Kyudenko Data: Preloaded financial metrics – encompassing revenue, EBIT, and more – based on both historical and forecasted figures.
- Complete Customization: Modify all key parameters (highlighted cells) such as WACC, growth rates, and tax percentages.
- Immediate Valuation Updates: Automatic recalculations to evaluate the effects of changes on Kyudenko Corporation's (1959T) fair value.
- Flexible Excel Template: Designed for quick adjustments, scenario analysis, and comprehensive forecasting.
- Efficient and Precise: Avoid starting from scratch while ensuring accuracy and adaptability.
Key Features
- Customizable Forecast Inputs: Adjust essential metrics such as revenue growth, EBITDA margin, and capital expenditures.
- Instant DCF Valuation: Quickly determines intrinsic value, NPV, and various outputs automatically.
- High Precision Accuracy: Leverages Kyudenko Corporation's real financial data for dependable valuation results.
- Streamlined Scenario Analysis: Effortlessly evaluate different assumptions and analyze outcomes side by side.
- Efficiency Booster: Remove the hassle of constructing intricate valuation models from the ground up.
How It Operates
- Step 1: Download the pre-designed Excel template featuring Kyudenko Corporation's data.
- Step 2: Review the populated sheets to familiarize yourself with the essential metrics.
- Step 3: Modify forecasts and assumptions in the editable yellow cells (WACC, growth, margins).
- Step 4: Immediately see the recalculated results, including Kyudenko Corporation's intrinsic value.
- Step 5: Make well-informed investment choices or create reports using the generated outputs.
Why Choose Kyudenko Corporation's Calculator?
- Efficiency Boost: Skip the hassle of building a DCF model from the ground up – it’s ready for immediate use.
- Enhanced Precision: Dependable financial data and established formulas minimize valuation errors.
- Completely Customizable: Adjust the model to suit your specific assumptions and forecasts.
- User-Friendly: Intuitive charts and outputs facilitate easy interpretation of results.
- Endorsed by Professionals: Crafted for experts who prioritize accuracy and functionality.
Who Can Benefit from This Product?
- Finance Students: Master valuation methodologies and practice with actual market data.
- Researchers: Utilize industry-standard models for your academic projects or investigations.
- Investors: Evaluate your own hypotheses and assess the valuation metrics of Kyudenko Corporation (1959T).
- Analysts: Enhance your analysis process with a ready-to-use, customizable DCF model.
- Small Business Owners: Understand the valuation analysis of major public companies like Kyudenko Corporation (1959T).
Overview of the Template Features
- Comprehensive DCF Model: An editable template designed with intricate valuation calculations.
- Real-World Data: Kyudenko Corporation’s (1959T) historical and projected financials are preloaded for thorough analysis.
- Customizable Parameters: Modify WACC, growth rates, and tax assumptions to explore various scenarios.
- Financial Statements: Complete annual and quarterly breakdowns for enhanced insights.
- Key Ratios: Integrated analysis for profitability, efficiency, and leverage metrics.
- Dashboard with Visual Outputs: Charts and tables that present clear, actionable results.
Disclaimer
All information, articles, and product details provided on this website are for general informational and educational purposes only. We do not claim any ownership over, nor do we intend to infringe upon, any trademarks, copyrights, logos, brand names, or other intellectual property mentioned or depicted on this site. Such intellectual property remains the property of its respective owners, and any references here are made solely for identification or informational purposes, without implying any affiliation, endorsement, or partnership.
We make no representations or warranties, express or implied, regarding the accuracy, completeness, or suitability of any content or products presented. Nothing on this website should be construed as legal, tax, investment, financial, medical, or other professional advice. In addition, no part of this site—including articles or product references—constitutes a solicitation, recommendation, endorsement, advertisement, or offer to buy or sell any securities, franchises, or other financial instruments, particularly in jurisdictions where such activity would be unlawful.
All content is of a general nature and may not address the specific circumstances of any individual or entity. It is not a substitute for professional advice or services. Any actions you take based on the information provided here are strictly at your own risk. You accept full responsibility for any decisions or outcomes arising from your use of this website and agree to release us from any liability in connection with your use of, or reliance upon, the content or products found herein.