
|
CSG Holding Co., Ltd. (200012.SZ) DCF Valuation |
Fully Editable: Tailor To Your Needs In Excel Or Sheets
Professional Design: Trusted, Industry-Standard Templates
Investor-Approved Valuation Models
MAC/PC Compatible, Fully Unlocked
No Expertise Is Needed; Easy To Follow
CSG Holding Co., Ltd. (200012.SZ) Bundle
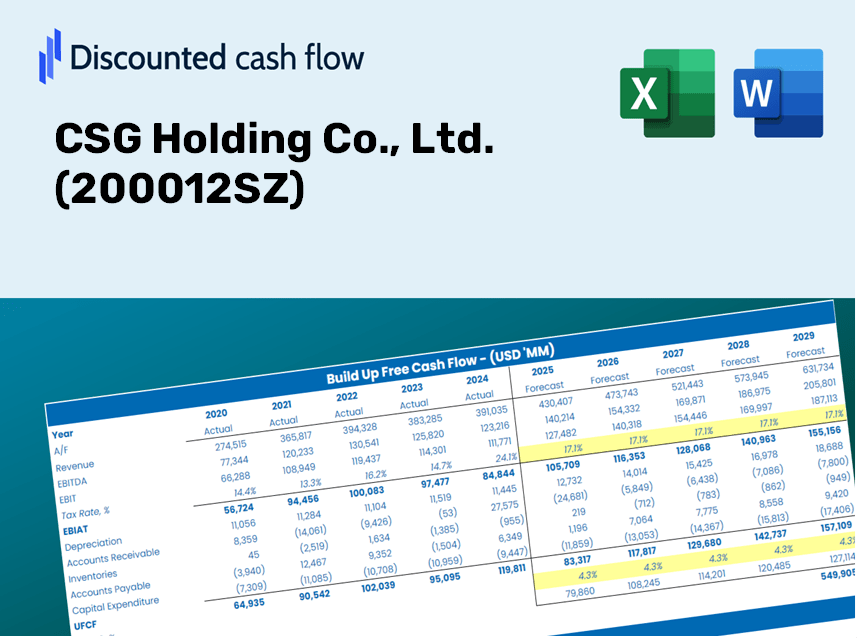
Engineered for accuracy, our (200012SZ) DCF Calculator enables you to evaluate CSG Holding Co., Ltd. valuation using actual financial data, offering complete flexibility to modify all essential parameters for improved forecasts.
Discounted Cash Flow (DCF) - (USD MM)
| Year | AY1 2020 |
AY2 2021 |
AY3 2022 |
AY4 2023 |
AY5 2024 |
FY1 2025 |
FY2 2026 |
FY3 2027 |
FY4 2028 |
FY5 2029 |
|---|---|---|---|---|---|---|---|---|---|---|
| Revenue | 11,637.0 | 14,862.5 | 16,574.2 | 19,841.5 | 16,854.1 | 18,703.5 | 20,755.8 | 23,033.3 | 25,560.7 | 28,365.4 |
| Revenue Growth, % | 0 | 27.72 | 11.52 | 19.71 | -15.06 | 10.97 | 10.97 | 10.97 | 10.97 | 10.97 |
| EBITDA | 2,950.9 | 3,335.3 | 3,806.8 | 3,390.7 | 2,018.4 | 3,734.4 | 4,144.2 | 4,598.9 | 5,103.6 | 5,663.6 |
| EBITDA, % | 25.36 | 22.44 | 22.97 | 17.09 | 11.98 | 19.97 | 19.97 | 19.97 | 19.97 | 19.97 |
| Depreciation | 1,005.1 | 1,042.0 | 1,089.8 | 1,362.0 | 1,439.0 | 1,407.5 | 1,561.9 | 1,733.3 | 1,923.5 | 2,134.6 |
| Depreciation, % | 8.64 | 7.01 | 6.58 | 6.86 | 8.54 | 7.53 | 7.53 | 7.53 | 7.53 | 7.53 |
| EBIT | 1,945.8 | 2,293.3 | 2,717.1 | 2,028.7 | 579.4 | 2,327.0 | 2,582.3 | 2,865.6 | 3,180.1 | 3,529.0 |
| EBIT, % | 16.72 | 15.43 | 16.39 | 10.22 | 3.44 | 12.44 | 12.44 | 12.44 | 12.44 | 12.44 |
| Total Cash | 2,318.2 | 4,106.3 | 5,021.3 | 3,490.7 | 3,835.9 | 4,421.4 | 4,906.6 | 5,444.9 | 6,042.4 | 6,705.4 |
| Total Cash, percent | .0 | .0 | .0 | .0 | .0 | .0 | .0 | .0 | .0 | .0 |
| Account Receivables | 1,387.1 | 1,341.8 | 2,652.5 | 4,367.7 | 4,135.2 | 3,123.5 | 3,466.2 | 3,846.6 | 4,268.6 | 4,737.0 |
| Account Receivables, % | 11.92 | 9.03 | 16 | 22.01 | 24.54 | 16.7 | 16.7 | 16.7 | 16.7 | 16.7 |
| Inventories | 888.9 | 1,192.8 | 1,945.4 | 1,734.1 | 1,731.5 | 1,736.3 | 1,926.8 | 2,138.2 | 2,372.8 | 2,633.2 |
| Inventories, % | 7.64 | 8.03 | 11.74 | 8.74 | 10.27 | 9.28 | 9.28 | 9.28 | 9.28 | 9.28 |
| Accounts Payable | 89.8 | 227.1 | 701.6 | 3,258.5 | 5,819.4 | 2,150.3 | 2,386.2 | 2,648.1 | 2,938.6 | 3,261.1 |
| Accounts Payable, % | 0.77175 | 1.53 | 4.23 | 16.42 | 34.53 | 11.5 | 11.5 | 11.5 | 11.5 | 11.5 |
| Capital Expenditure | -1,211.3 | -1,992.5 | -3,726.2 | -4,653.6 | -2,550.1 | -3,175.2 | -3,523.6 | -3,910.2 | -4,339.3 | -4,815.4 |
| Capital Expenditure, % | -10.41 | -13.41 | -22.48 | -23.45 | -15.13 | -16.98 | -16.98 | -16.98 | -16.98 | -16.98 |
| Tax Rate, % | 8.3 | 8.3 | 8.3 | 8.3 | 8.3 | 8.3 | 8.3 | 8.3 | 8.3 | 8.3 |
| EBITAT | 1,371.5 | 1,825.6 | 2,428.9 | 2,057.8 | 531.3 | 2,006.7 | 2,226.9 | 2,471.3 | 2,742.4 | 3,043.3 |
| Depreciation | ||||||||||
| Changes in Account Receivables | ||||||||||
| Changes in Inventories | ||||||||||
| Changes in Accounts Payable | ||||||||||
| Capital Expenditure | ||||||||||
| UFCF | -1,020.9 | 753.8 | -1,796.2 | -181.0 | 2,216.4 | -2,423.1 | -32.1 | -35.6 | -39.5 | -43.8 |
| WACC, % | 4.45 | 4.64 | 4.86 | 5.08 | 4.91 | 4.79 | 4.79 | 4.79 | 4.79 | 4.79 |
| PV UFCF | ||||||||||
| SUM PV UFCF | -2,439.9 | |||||||||
| Long Term Growth Rate, % | 2.00 | |||||||||
| Free cash flow (T + 1) | -45 | |||||||||
| Terminal Value | -1,603 | |||||||||
| Present Terminal Value | -1,269 | |||||||||
| Enterprise Value | -3,709 | |||||||||
| Net Debt | 4,269 | |||||||||
| Equity Value | -7,978 | |||||||||
| Diluted Shares Outstanding, MM | 2,964 | |||||||||
| Equity Value Per Share | -2.69 |
Benefits You Will Receive
- Adjustable Forecast Parameters: Seamlessly modify key inputs (growth %, margins, WACC) to explore various scenarios.
- Comprehensive Financial Data: CSG Holding Co., Ltd.'s (200012SZ) financial information pre-included to kickstart your analysis.
- Automated DCF Calculations: The template computes Net Present Value (NPV) and intrinsic value automatically.
- Professional and Customizable: A refined Excel model tailored to meet your valuation requirements.
- Designed for Investors and Analysts: Perfect for testing forecasts, validating strategies, and optimizing efficiency.
Key Features
- Genuine CSG Financial Data: Gain access to precise historical figures and future forecasts that are pre-loaded.
- Tailorable Forecast Parameters: Modify the highlighted fields, including WACC, growth rates, and profit margins.
- Interactive Calculations: Enjoy automatic adjustments to DCF, Net Present Value (NPV), and cash flow evaluations.
- Visual Insights Dashboard: Clear and concise charts and summaries to help you visualize valuation outcomes.
- Designed for All Skill Levels: An intuitive layout catering to investors, CFOs, and consultants alike.
How It Functions
- Download the Template: Gain immediate access to the Excel-based CSG Holding Co. DCF Calculator.
- Input Your Assumptions: Modify the yellow-highlighted cells for growth rates, WACC, margins, and more.
- Instant Calculations: The model automatically refreshes CSG’s intrinsic value.
- Test Scenarios: Experiment with various assumptions to assess potential changes in valuation.
- Analyze and Decide: Utilize the results to inform your investment or financial analysis.
Why Opt for This Calculator?
- Designed for Professionals: A sophisticated tool favored by analysts, CFOs, and consultants.
- Comprehensive Data: CSG Holding Co., Ltd.'s historical and projected financials are preloaded for optimal precision.
- Scenario Analysis: Effortlessly simulate various forecasts and assumptions.
- Intuitive Outputs: Automatically computes intrinsic value, NPV, and essential metrics.
- User-Friendly: Step-by-step guidance ensures a smooth experience throughout the process.
Who Can Benefit from This Product?
- Institutional Investors: Develop comprehensive and accurate valuation models for their investment analysis of CSG Holding Co., Ltd. (200012SZ).
- Corporate Finance Departments: Evaluate valuation scenarios to inform strategic decisions within the organization.
- Financial Consultants and Advisors: Deliver precise valuation insights to clients regarding CSG Holding Co., Ltd. (200012SZ).
- Students and Educators: Utilize real-time data to enhance learning and practice in financial modeling.
- Technology Enthusiasts: Explore how technology companies like CSG Holding Co., Ltd. (200012SZ) are assessed in the financial market.
Contents of the CSG Holding Co., Ltd. Template
- Comprehensive DCF Model: An editable template featuring detailed valuation calculations.
- Real-World Data: CSG Holding Co., Ltd.’s historical and projected financials preloaded for analysis.
- Customizable Parameters: Modify WACC, growth rates, and tax assumptions to explore different scenarios.
- Financial Statements: Complete annual and quarterly breakdowns for in-depth insights.
- Key Ratios: Integrated analysis for profitability, efficiency, and leverage metrics.
- Dashboard with Visual Outputs: Charts and tables that present clear, actionable results.
Disclaimer
All information, articles, and product details provided on this website are for general informational and educational purposes only. We do not claim any ownership over, nor do we intend to infringe upon, any trademarks, copyrights, logos, brand names, or other intellectual property mentioned or depicted on this site. Such intellectual property remains the property of its respective owners, and any references here are made solely for identification or informational purposes, without implying any affiliation, endorsement, or partnership.
We make no representations or warranties, express or implied, regarding the accuracy, completeness, or suitability of any content or products presented. Nothing on this website should be construed as legal, tax, investment, financial, medical, or other professional advice. In addition, no part of this site—including articles or product references—constitutes a solicitation, recommendation, endorsement, advertisement, or offer to buy or sell any securities, franchises, or other financial instruments, particularly in jurisdictions where such activity would be unlawful.
All content is of a general nature and may not address the specific circumstances of any individual or entity. It is not a substitute for professional advice or services. Any actions you take based on the information provided here are strictly at your own risk. You accept full responsibility for any decisions or outcomes arising from your use of this website and agree to release us from any liability in connection with your use of, or reliance upon, the content or products found herein.