
|
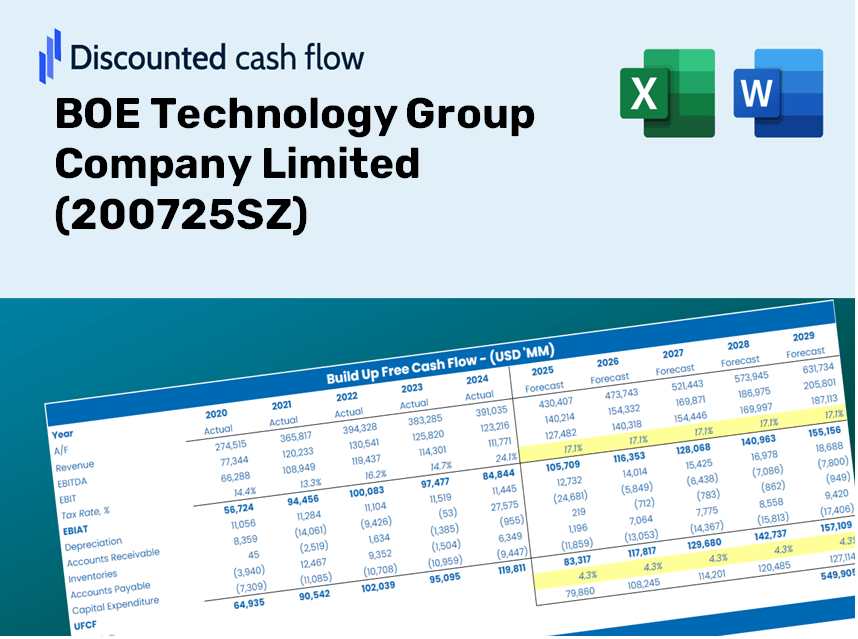
BOE Technology Group Company Limited (200725.SZ) DCF Valuation |
Fully Editable: Tailor To Your Needs In Excel Or Sheets
Professional Design: Trusted, Industry-Standard Templates
Investor-Approved Valuation Models
MAC/PC Compatible, Fully Unlocked
No Expertise Is Needed; Easy To Follow
BOE Technology Group Company Limited (200725.SZ) Bundle
Designed for accuracy, our (200725SZ) DCF Calculator enables you to assess the valuation of BOE Technology Group Company Limited using real-world financial data, providing complete flexibility to modify all essential parameters for enhanced projections.
Discounted Cash Flow (DCF) - (USD MM)
| Year | AY1 2020 |
AY2 2021 |
AY3 2022 |
AY4 2023 |
AY5 2024 |
FY1 2025 |
FY2 2026 |
FY3 2027 |
FY4 2028 |
FY5 2029 |
|---|---|---|---|---|---|---|---|---|---|---|
| Revenue | 147,967.0 | 239,395.0 | 194,753.6 | 190,528.8 | 216,549.1 | 246,124.0 | 279,738.0 | 317,942.8 | 361,365.4 | 410,718.4 |
| Revenue Growth, % | 0 | 61.79 | -18.65 | -2.17 | 13.66 | 13.66 | 13.66 | 13.66 | 13.66 | 13.66 |
| EBITDA | 31,251.3 | 79,426.5 | 27,777.5 | 35,221.9 | 51,709.4 | 54,603.4 | 62,060.8 | 70,536.6 | 80,170.1 | 91,119.2 |
| EBITDA, % | 21.12 | 33.18 | 14.26 | 18.49 | 23.88 | 22.19 | 22.19 | 22.19 | 22.19 | 22.19 |
| Depreciation | 24,494.5 | 37,787.8 | 37,569.4 | 37,852.5 | 41,755.3 | 44,685.6 | 50,788.5 | 57,724.9 | 65,608.6 | 74,569.0 |
| Depreciation, % | 16.55 | 15.78 | 19.29 | 19.87 | 19.28 | 18.16 | 18.16 | 18.16 | 18.16 | 18.16 |
| EBIT | 6,756.8 | 41,638.7 | -9,791.9 | -2,630.6 | 9,954.1 | 9,917.8 | 11,272.3 | 12,811.7 | 14,561.5 | 16,550.2 |
| EBIT, % | 4.57 | 17.39 | -5.03 | -1.38 | 4.6 | 4.03 | 4.03 | 4.03 | 4.03 | 4.03 |
| Total Cash | 85,210.7 | 99,350.5 | 93,863.4 | 87,570.5 | 84,454.8 | 114,322.8 | 129,936.3 | 147,682.2 | 167,851.7 | 190,775.8 |
| Total Cash, percent | .0 | .0 | .0 | .0 | .0 | .0 | .0 | .0 | .0 | .0 |
| Account Receivables | 25,363.0 | 39,075.3 | 31,096.0 | 38,174.8 | 41,603.0 | 43,651.7 | 49,613.4 | 56,389.3 | 64,090.6 | 72,843.7 |
| Account Receivables, % | 17.14 | 16.32 | 15.97 | 20.04 | 19.21 | 17.74 | 17.74 | 17.74 | 17.74 | 17.74 |
| Inventories | 19,512.6 | 30,351.7 | 24,874.8 | 26,328.6 | 25,448.6 | 31,606.6 | 35,923.2 | 40,829.4 | 46,405.6 | 52,743.3 |
| Inventories, % | 13.19 | 12.68 | 12.77 | 13.82 | 11.75 | 12.84 | 12.84 | 12.84 | 12.84 | 12.84 |
| Accounts Payable | 30,996.3 | 36,332.0 | 33,517.0 | 37,001.3 | 41,603.6 | 45,270.6 | 51,453.4 | 58,480.6 | 66,467.5 | 75,545.2 |
| Accounts Payable, % | 20.95 | 15.18 | 17.21 | 19.42 | 19.21 | 18.39 | 18.39 | 18.39 | 18.39 | 18.39 |
| Capital Expenditure | -48,264.7 | -38,936.7 | -32,090.7 | -27,079.8 | -37,155.1 | -47,615.9 | -54,119.0 | -61,510.2 | -69,910.9 | -79,458.9 |
| Capital Expenditure, % | -32.62 | -16.26 | -16.48 | -14.21 | -17.16 | -19.35 | -19.35 | -19.35 | -19.35 | -19.35 |
| Tax Rate, % | -4.67 | -4.67 | -4.67 | -4.67 | -4.67 | -4.67 | -4.67 | -4.67 | -4.67 | -4.67 |
| EBITAT | 5,584.4 | 31,224.2 | 332,108.4 | -3,655.9 | 10,419.1 | 7,093.9 | 8,062.7 | 9,163.9 | 10,415.5 | 11,837.9 |
| Depreciation | ||||||||||
| Changes in Account Receivables | ||||||||||
| Changes in Inventories | ||||||||||
| Changes in Accounts Payable | ||||||||||
| Capital Expenditure | ||||||||||
| UFCF | -32,065.1 | 10,859.7 | 348,228.2 | 2,068.5 | 17,073.3 | -376.1 | 636.7 | 723.7 | 822.5 | 934.8 |
| WACC, % | 5.65 | 5.49 | 3.89 | 6.02 | 6.02 | 5.42 | 5.42 | 5.42 | 5.42 | 5.42 |
| PV UFCF | ||||||||||
| SUM PV UFCF | 2,218.2 | |||||||||
| Long Term Growth Rate, % | 2.00 | |||||||||
| Free cash flow (T + 1) | 954 | |||||||||
| Terminal Value | 27,911 | |||||||||
| Present Terminal Value | 21,441 | |||||||||
| Enterprise Value | 23,659 | |||||||||
| Net Debt | 31,519 | |||||||||
| Equity Value | -7,860 | |||||||||
| Diluted Shares Outstanding, MM | 37,650 | |||||||||
| Equity Value Per Share | -0.21 |
What You Will Receive
- Authentic BOE Financial Data: Provides historical and projected figures for precise valuation.
- Customizable Parameters: Adjust WACC, tax rates, revenue growth, and capital expenditures as needed.
- Automated Calculations: Intrinsic value and NPV are computed in real-time.
- Scenario Analysis: Explore various scenarios to assess BOE's future performance.
- User-Friendly Design: Designed for professionals while remaining accessible for newcomers.
Key Features
- 🔍 Real-Life BOE Financials: Pre-filled historical and projected data for BOE Technology Group Company Limited (200725SZ).
- ✏️ Fully Customizable Inputs: Modify all essential parameters (yellow cells) such as WACC, growth %, and tax rates.
- 📊 Professional DCF Valuation: Integrated formulas calculate BOE’s intrinsic value using the Discounted Cash Flow method.
- ⚡ Instant Results: Visualize BOE’s valuation immediately after adjustments.
- Scenario Analysis: Evaluate and compare outcomes for various financial assumptions side-by-side.
How It Works
- Step 1: Download the Excel file.
- Step 2: Review the pre-filled BOE Technology data (historical and projected).
- Step 3: Modify key assumptions (highlighted in yellow) according to your analysis.
- Step 4: Observe the automatic recalculations for the intrinsic value of BOE Technology [200725SZ].
- Step 5: Utilize the results for your investment choices or reporting needs.
Why Choose This Calculator for BOE Technology Group (200725SZ)?
- All-in-One Solution: Offers DCF, WACC, and extensive financial ratio analyses in a single platform.
- Flexible Inputs: Modify the highlighted cells to evaluate different scenarios easily.
- In-Depth Analysis: Automatically computes the intrinsic value and Net Present Value for BOE Technology Group.
- Integrated Data: Comes with historical and projected data for reliable starting points.
- High-Caliber Tool: Perfect for financial analysts, investors, and business consultants focused on BOE Technology Group.
Who Should Consider Using This Product?
- Institutional Investors: Develop comprehensive and trustworthy valuation models for investment assessments related to BOE Technology Group (200725SZ).
- Corporate Finance Departments: Examine valuation scenarios to inform strategic decisions within their organizations.
- Financial Consultants and Advisors: Equip clients with precise valuation insights specific to BOE Technology Group (200725SZ).
- Students and Instructors: Leverage real-world data to enhance learning and practice financial modeling techniques.
- Technology Aficionados: Gain a deeper understanding of how technology firms like BOE Technology Group (200725SZ) are valued in the financial markets.
Contents of the Template
- Historical Data: Contains BOE Technology Group’s previous financial performance and foundational forecasts.
- DCF and Levered DCF Models: Comprehensive templates for assessing the intrinsic value of BOE Technology Group.
- WACC Sheet: Pre-formulated calculations for the Weighted Average Cost of Capital.
- Editable Inputs: Adjust essential parameters such as growth rates, EBITDA margins, and CAPEX projections.
- Quarterly and Annual Statements: An in-depth overview of BOE Technology Group’s financial data.
- Interactive Dashboard: Dynamically visualize valuation outcomes and forecasts.
Disclaimer
All information, articles, and product details provided on this website are for general informational and educational purposes only. We do not claim any ownership over, nor do we intend to infringe upon, any trademarks, copyrights, logos, brand names, or other intellectual property mentioned or depicted on this site. Such intellectual property remains the property of its respective owners, and any references here are made solely for identification or informational purposes, without implying any affiliation, endorsement, or partnership.
We make no representations or warranties, express or implied, regarding the accuracy, completeness, or suitability of any content or products presented. Nothing on this website should be construed as legal, tax, investment, financial, medical, or other professional advice. In addition, no part of this site—including articles or product references—constitutes a solicitation, recommendation, endorsement, advertisement, or offer to buy or sell any securities, franchises, or other financial instruments, particularly in jurisdictions where such activity would be unlawful.
All content is of a general nature and may not address the specific circumstances of any individual or entity. It is not a substitute for professional advice or services. Any actions you take based on the information provided here are strictly at your own risk. You accept full responsibility for any decisions or outcomes arising from your use of this website and agree to release us from any liability in connection with your use of, or reliance upon, the content or products found herein.