
|
China International Marine Containers Co., Ltd. (2039.HK) DCF Valuation |
Fully Editable: Tailor To Your Needs In Excel Or Sheets
Professional Design: Trusted, Industry-Standard Templates
Investor-Approved Valuation Models
MAC/PC Compatible, Fully Unlocked
No Expertise Is Needed; Easy To Follow
China International Marine Containers (Group) Co., Ltd. (2039.HK) Bundle
Optimize your time and improve precision with our (2039HK) DCF Calculator! Utilizing authentic data from China International Marine Containers (Group) Co., Ltd. and customizable assumptions, this tool enables you to forecast, analyze, and evaluate (2039HK) like a seasoned investor.
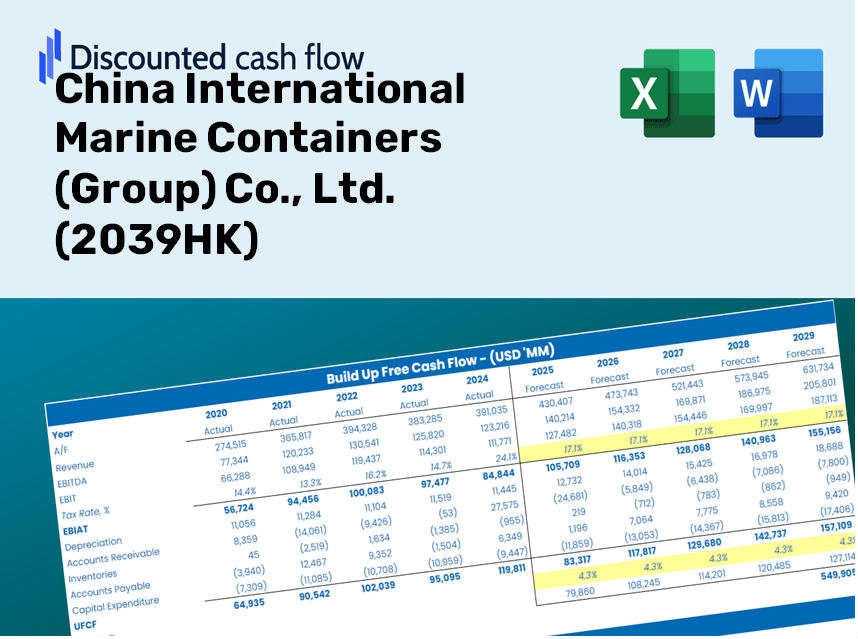
Discounted Cash Flow (DCF) - (USD MM)
| Year | AY1 2020 |
AY2 2021 |
AY3 2022 |
AY4 2023 |
AY5 2024 |
FY1 2025 |
FY2 2026 |
FY3 2027 |
FY4 2028 |
FY5 2029 |
|---|---|---|---|---|---|---|---|---|---|---|
| Revenue | 103,188.0 | 179,392.9 | 155,108.7 | 140,065.2 | 194,700.4 | 238,323.9 | 291,721.5 | 357,083.0 | 437,089.1 | 535,021.0 |
| Revenue Growth, % | 0 | 73.85 | -13.54 | -9.7 | 39.01 | 22.41 | 22.41 | 22.41 | 22.41 | 22.41 |
| EBITDA | 10,798.4 | 18,050.0 | 11,289.1 | 6,618.7 | 11,147.9 | 18,234.6 | 22,320.1 | 27,321.0 | 33,442.4 | 40,935.4 |
| EBITDA, % | 10.46 | 10.06 | 7.28 | 4.73 | 5.73 | 7.65 | 7.65 | 7.65 | 7.65 | 7.65 |
| Depreciation | 3,558.1 | 3,448.6 | 3,663.7 | 3,561.3 | 3,891.3 | 5,850.3 | 7,161.0 | 8,765.5 | 10,729.4 | 13,133.4 |
| Depreciation, % | 3.45 | 1.92 | 2.36 | 2.54 | 2 | 2.45 | 2.45 | 2.45 | 2.45 | 2.45 |
| EBIT | 7,240.3 | 14,601.4 | 7,625.5 | 3,057.4 | 7,256.6 | 12,384.3 | 15,159.1 | 18,555.5 | 22,713.0 | 27,801.9 |
| EBIT, % | 7.02 | 8.14 | 4.92 | 2.18 | 3.73 | 5.2 | 5.2 | 5.2 | 5.2 | 5.2 |
| Total Cash | 13,566.8 | 18,507.6 | 19,915.1 | 23,739.4 | 25,184.0 | 31,548.1 | 38,616.6 | 47,268.8 | 57,859.6 | 70,823.4 |
| Total Cash, percent | .0 | .0 | .0 | .0 | .0 | .0 | .0 | .0 | .0 | .0 |
| Account Receivables | 37,070.3 | 37,096.8 | 30,215.3 | 40,012.3 | 52,762.5 | 62,798.5 | 76,868.9 | 94,091.7 | 115,173.4 | 140,978.5 |
| Account Receivables, % | 35.92 | 20.68 | 19.48 | 28.57 | 27.1 | 26.35 | 26.35 | 26.35 | 26.35 | 26.35 |
| Inventories | 16,955.8 | 21,739.3 | 20,089.4 | 21,041.2 | 21,628.1 | 32,237.1 | 39,459.9 | 48,301.1 | 59,123.2 | 72,370.0 |
| Inventories, % | 16.43 | 12.12 | 12.95 | 15.02 | 11.11 | 13.53 | 13.53 | 13.53 | 13.53 | 13.53 |
| Accounts Payable | 18,933.2 | 24,899.1 | 21,580.3 | 27,247.1 | 36,150.0 | 40,115.2 | 49,103.2 | 60,105.0 | 73,571.9 | 90,056.0 |
| Accounts Payable, % | 18.35 | 13.88 | 13.91 | 19.45 | 18.57 | 16.83 | 16.83 | 16.83 | 16.83 | 16.83 |
| Capital Expenditure | -3,637.1 | -7,324.0 | -3,902.3 | -6,000.9 | -3,911.1 | -7,824.8 | -9,578.0 | -11,724.0 | -14,350.8 | -17,566.2 |
| Capital Expenditure, % | -3.52 | -4.08 | -2.52 | -4.28 | -2.01 | -3.28 | -3.28 | -3.28 | -3.28 | -3.28 |
| Tax Rate, % | 54.93 | 54.93 | 54.93 | 54.93 | 54.93 | 54.93 | 54.93 | 54.93 | 54.93 | 54.93 |
| EBITAT | 5,312.9 | 7,320.3 | 5,057.2 | 454.4 | 3,270.4 | 6,186.3 | 7,572.4 | 9,269.0 | 11,345.7 | 13,887.8 |
| Depreciation | ||||||||||
| Changes in Account Receivables | ||||||||||
| Changes in Inventories | ||||||||||
| Changes in Accounts Payable | ||||||||||
| Capital Expenditure | ||||||||||
| UFCF | -29,859.0 | 4,600.7 | 10,031.2 | -7,067.3 | -1,183.6 | -12,468.0 | -7,149.8 | -8,751.7 | -10,712.6 | -13,112.8 |
| WACC, % | 5.46 | 5.05 | 5.34 | 4.43 | 4.96 | 5.05 | 5.05 | 5.05 | 5.05 | 5.05 |
| PV UFCF | ||||||||||
| SUM PV UFCF | -44,946.2 | |||||||||
| Long Term Growth Rate, % | 2.00 | |||||||||
| Free cash flow (T + 1) | -13,375 | |||||||||
| Terminal Value | -438,866 | |||||||||
| Present Terminal Value | -343,084 | |||||||||
| Enterprise Value | -388,030 | |||||||||
| Net Debt | 15,257 | |||||||||
| Equity Value | -403,287 | |||||||||
| Diluted Shares Outstanding, MM | 5,368 | |||||||||
| Equity Value Per Share | -75.13 |
What You Will Receive
- Authentic 2039HK Financial Data: Pre-loaded with China International Marine Containers' historical and projected financial metrics for accurate analysis.
- Completely Customizable Template: Easily adjust key inputs such as revenue growth, WACC, and EBITDA percentage.
- Instant Calculations: Watch as the intrinsic value of 2039HK updates in real time based on your modifications.
- Professional Valuation Tool: Tailored for investors, analysts, and consultants aiming for precise DCF outcomes.
- Intuitive Design: User-friendly layout and clear guidance suitable for all skill levels.
Key Features
- Customizable Forecast Inputs: Adjust essential factors such as revenue growth, EBITDA percentage, and capital expenditure forecasts.
- Instant DCF Valuation: Automatically computes intrinsic value, NPV, and additional financial metrics without delay.
- High-Precision Accuracy: Relies on real-world financial data from China International Marine Containers (Group) Co., Ltd. (2039HK) for credible valuation results.
- Simplified Scenario Testing: Easily evaluate various assumptions and analyze different outcomes with ease.
- Efficiency Boosting Tool: Streamline your process by avoiding the complexities of building valuation models from the ground up.
How It Works
- Download the Template: Gain immediate access to the Excel-based CIMC DCF Calculator for China International Marine Containers (Group) Co., Ltd. (2039HK).
- Input Your Assumptions: Modify the yellow-highlighted cells to set growth rates, WACC, margins, and more.
- Instant Calculations: The model will automatically recalculate the intrinsic value of CIMC.
- Test Scenarios: Experiment with different assumptions to assess potential changes in valuation.
- Analyze and Decide: Use the outcomes to inform your investment or financial analysis.
Why Opt for This Calculator?
- All-in-One Solution: Features DCF, WACC, and financial ratio analyses tailored for China International Marine Containers (Group) Co., Ltd. (2039HK).
- Flexible Parameters: Modify the yellow-highlighted cells to experiment with different scenarios.
- In-Depth Analysis: Automatically determines the intrinsic value and Net Present Value for China International Marine Containers (Group) Co., Ltd. (2039HK).
- Data Ready: Comes with historical and projected data for precise baseline calculations.
- Designed for Professionals: Perfect for financial analysts, investors, and business consultants focused on China International Marine Containers (Group) Co., Ltd. (2039HK).
Who Can Benefit from This Product?
- Investors: Assess the valuation of China International Marine Containers (Group) Co., Ltd. (2039HK) before making trading decisions.
- CFOs and Financial Analysts: Enhance valuation methodologies and evaluate financial forecasts.
- Startup Founders: Discover how leading public companies like China International Marine Containers (Group) Co., Ltd. (2039HK) are valued.
- Consultants: Create detailed valuation reports for your clients.
- Students and Educators: Apply real-world examples to learn and teach valuation strategies.
What the Template Contains
- Pre-Filled DCF Model: China International Marine Containers (Group) Co., Ltd.'s (2039HK) financial data preloaded for immediate use.
- WACC Calculator: Comprehensive calculations for Weighted Average Cost of Capital.
- Financial Ratios: Assess (2039HK)'s profitability, leverage, and efficiency metrics.
- Editable Inputs: Modify assumptions such as growth rates, margins, and CAPEX to suit your scenarios.
- Financial Statements: Annual and quarterly reports to facilitate in-depth analysis.
- Interactive Dashboard: Effortlessly visualize key valuation metrics and outcomes.
Disclaimer
All information, articles, and product details provided on this website are for general informational and educational purposes only. We do not claim any ownership over, nor do we intend to infringe upon, any trademarks, copyrights, logos, brand names, or other intellectual property mentioned or depicted on this site. Such intellectual property remains the property of its respective owners, and any references here are made solely for identification or informational purposes, without implying any affiliation, endorsement, or partnership.
We make no representations or warranties, express or implied, regarding the accuracy, completeness, or suitability of any content or products presented. Nothing on this website should be construed as legal, tax, investment, financial, medical, or other professional advice. In addition, no part of this site—including articles or product references—constitutes a solicitation, recommendation, endorsement, advertisement, or offer to buy or sell any securities, franchises, or other financial instruments, particularly in jurisdictions where such activity would be unlawful.
All content is of a general nature and may not address the specific circumstances of any individual or entity. It is not a substitute for professional advice or services. Any actions you take based on the information provided here are strictly at your own risk. You accept full responsibility for any decisions or outcomes arising from your use of this website and agree to release us from any liability in connection with your use of, or reliance upon, the content or products found herein.