
|
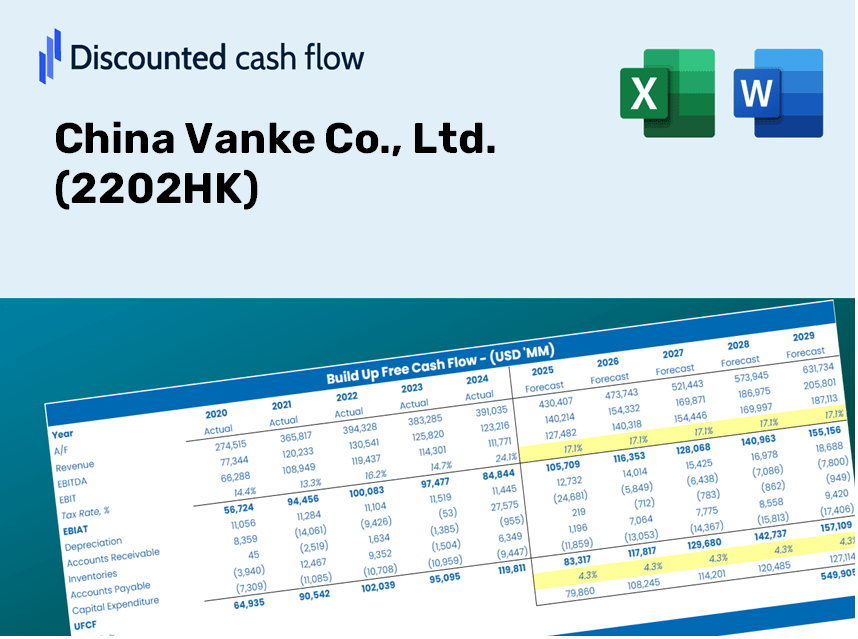
China Vanke Co., Ltd. (2202.HK) DCF Valuation |
Fully Editable: Tailor To Your Needs In Excel Or Sheets
Professional Design: Trusted, Industry-Standard Templates
Investor-Approved Valuation Models
MAC/PC Compatible, Fully Unlocked
No Expertise Is Needed; Easy To Follow
China Vanke Co., Ltd. (2202.HK) Bundle
Enhance your investment strategy with the (2202HK) DCF Calculator! Explore genuine financial data from China Vanke Co., Ltd., adjust growth projections and expenses, and instantly observe how these modifications affect the intrinsic value of (2202HK).
Discounted Cash Flow (DCF) - (USD MM)
| Year | AY1 2020 |
AY2 2021 |
AY3 2022 |
AY4 2023 |
AY5 2024 |
FY1 2025 |
FY2 2026 |
FY3 2027 |
FY4 2028 |
FY5 2029 |
|---|---|---|---|---|---|---|---|---|---|---|
| Revenue | 459,300.5 | 496,216.7 | 552,151.6 | 510,399.0 | 376,083.8 | 362,387.0 | 349,189.1 | 336,471.8 | 324,217.7 | 312,409.9 |
| Revenue Growth, % | 0 | 8.04 | 11.27 | -7.56 | -26.32 | -3.64 | -3.64 | -3.64 | -3.64 | -3.64 |
| EBITDA | 103,487.8 | 73,463.3 | 60,879.9 | 47,923.2 | -49,030.3 | 32,407.9 | 31,227.7 | 30,090.4 | 28,994.5 | 27,938.5 |
| EBITDA, % | 22.53 | 14.8 | 11.03 | 9.39 | -13.04 | 8.94 | 8.94 | 8.94 | 8.94 | 8.94 |
| Depreciation | 7,654.7 | 8,836.5 | 10,191.7 | 9,951.6 | 9,558.0 | 7,091.5 | 6,833.2 | 6,584.4 | 6,344.6 | 6,113.5 |
| Depreciation, % | 1.67 | 1.78 | 1.85 | 1.95 | 2.54 | 1.96 | 1.96 | 1.96 | 1.96 | 1.96 |
| EBIT | 95,833.1 | 64,626.8 | 50,688.2 | 37,971.6 | -58,588.3 | 25,316.4 | 24,394.4 | 23,506.0 | 22,649.9 | 21,825.0 |
| EBIT, % | 20.87 | 13.02 | 9.18 | 7.44 | -15.58 | 6.99 | 6.99 | 6.99 | 6.99 | 6.99 |
| Total Cash | 214,138.3 | 163,696.5 | 150,384.4 | 109,399.9 | 96,810.5 | 111,632.3 | 107,566.7 | 103,649.2 | 99,874.4 | 96,237.0 |
| Total Cash, percent | .0 | .0 | .0 | .0 | .0 | .0 | .0 | .0 | .0 | .0 |
| Account Receivables | 10,043.4 | 16,615.1 | 20,206.9 | .0 | 265,595.7 | 57,848.7 | 55,741.8 | 53,711.8 | 51,755.6 | 49,870.7 |
| Account Receivables, % | 2.19 | 3.35 | 3.66 | 0 | 70.62 | 15.96 | 15.96 | 15.96 | 15.96 | 15.96 |
| Inventories | 1,098,151.2 | 1,178,758.4 | 994,035.0 | 768,981.7 | 568,777.5 | 362,387.0 | 349,189.1 | 336,471.8 | 324,217.7 | 312,409.9 |
| Inventories, % | 239.09 | 237.55 | 180.03 | 150.66 | 151.24 | 100 | 100 | 100 | 100 | 100 |
| Accounts Payable | 324,703.1 | 362,231.9 | 316,977.0 | 26,926.2 | 175,378.7 | 183,375.0 | 176,696.6 | 170,261.4 | 164,060.6 | 158,085.6 |
| Accounts Payable, % | 70.7 | 73 | 57.41 | 5.28 | 46.63 | 50.6 | 50.6 | 50.6 | 50.6 | 50.6 |
| Capital Expenditure | -7,899.5 | -10,496.3 | -14,056.7 | -9,133.3 | -4,953.0 | -6,876.2 | -6,625.8 | -6,384.5 | -6,152.0 | -5,927.9 |
| Capital Expenditure, % | -1.72 | -2.12 | -2.55 | -1.79 | -1.32 | -1.9 | -1.9 | -1.9 | -1.9 | -1.9 |
| Tax Rate, % | -4.86 | -4.86 | -4.86 | -4.86 | -4.86 | -4.86 | -4.86 | -4.86 | -4.86 | -4.86 |
| EBITAT | 71,323.1 | 47,112.0 | 36,333.8 | 15,495.1 | -61,433.9 | 18,218.3 | 17,554.8 | 16,915.4 | 16,299.4 | 15,705.8 |
| Depreciation | ||||||||||
| Changes in Account Receivables | ||||||||||
| Changes in Inventories | ||||||||||
| Changes in Accounts Payable | ||||||||||
| Capital Expenditure | ||||||||||
| UFCF | -712,413.2 | -4,197.9 | 168,345.6 | -28,477.3 | 26,232.0 | 440,567.4 | 26,388.5 | 25,427.5 | 24,501.4 | 23,609.1 |
| WACC, % | 3.55 | 3.5 | 3.46 | 2.5 | 4.35 | 3.47 | 3.47 | 3.47 | 3.47 | 3.47 |
| PV UFCF | ||||||||||
| SUM PV UFCF | 514,659.0 | |||||||||
| Long Term Growth Rate, % | 2.00 | |||||||||
| Free cash flow (T + 1) | 24,081 | |||||||||
| Terminal Value | 1,635,172 | |||||||||
| Present Terminal Value | 1,378,588 | |||||||||
| Enterprise Value | 1,893,247 | |||||||||
| Net Debt | 161,866 | |||||||||
| Equity Value | 1,731,381 | |||||||||
| Diluted Shares Outstanding, MM | 11,865 | |||||||||
| Equity Value Per Share | 145.92 |
What You Will Receive
- Flexible Forecast Parameters: Easily modify assumptions (growth %, margins, WACC) to explore various scenarios.
- Actual Market Data: China Vanke Co., Ltd.’s financial data pre-filled to expedite your analysis.
- Instant DCF Calculations: The template automatically computes Net Present Value (NPV) and intrinsic value for your convenience.
- Custom and Professional Design: A refined Excel model tailored to meet your valuation requirements.
- Designed for Analysts and Investors: Perfect for testing forecasts, validating strategies, and enhancing efficiency.
Key Features
- 🔍 Real-Life 2202HK Financials: Pre-filled historical and projected data for China Vanke Co., Ltd.
- ✏️ Fully Customizable Inputs: Modify essential parameters (yellow cells) such as WACC, growth %, and tax rates.
- 📊 Professional DCF Valuation: Integrated formulas compute the intrinsic value of China Vanke using the Discounted Cash Flow method.
- ⚡ Instant Results: View China Vanke's valuation in real-time after making adjustments.
- Scenario Analysis: Evaluate and compare outcomes for different financial assumptions side-by-side.
How It Functions
- 1. Access the Template: Download and open the Excel file featuring China Vanke Co., Ltd.'s preloaded data.
- 2. Adjust Assumptions: Modify key variables such as growth projections, WACC, and capital investments.
- 3. View Real-Time Results: The DCF model instantly computes the intrinsic value and NPV.
- 4. Experiment with Scenarios: Assess various forecasts to evaluate different valuation results.
- 5. Leverage with Assurance: Present high-quality valuation insights to bolster your decisions.
Why Choose This Calculator for China Vanke Co., Ltd. (2202HK)?
- All-in-One Solution: Combines DCF, WACC, and financial ratio analyses into a single tool.
- Flexible Input Options: Modify yellow-highlighted fields to explore different financial scenarios.
- In-Depth Analysis: Automatically computes China Vanke's intrinsic value and Net Present Value.
- Preloaded Information: Historical and projected data provide accurate benchmarks.
- High Professional Standard: Perfect for financial analysts, investors, and business advisors.
Who Can Benefit from China Vanke Co., Ltd. (2202HK)?
- Investors: Make informed investment choices utilizing a top-notch valuation instrument.
- Financial Analysts: Streamline your workflow with a customizable DCF model at your fingertips.
- Consultants: Effortlessly modify the template for client presentations or analytical reports.
- Real Estate Enthusiasts: Enhance your knowledge of valuation methods through real-world case studies.
- Educators and Students: Utilize this resource as a hands-on learning tool in finance and real estate courses.
Contents of the Template
- Comprehensive DCF Model: Editable template featuring in-depth valuation calculations.
- Real-World Data: China Vanke Co., Ltd. (2202HK) historical and projected financials preloaded for analysis.
- Customizable Parameters: Modify WACC, growth rates, and tax assumptions to evaluate different scenarios.
- Financial Statements: Complete annual and quarterly breakdowns for enhanced insights.
- Key Ratios: Integrated analysis for profitability, efficiency, and leverage metrics.
- Dashboard with Visual Outputs: Charts and tables providing clear, actionable results.
Disclaimer
All information, articles, and product details provided on this website are for general informational and educational purposes only. We do not claim any ownership over, nor do we intend to infringe upon, any trademarks, copyrights, logos, brand names, or other intellectual property mentioned or depicted on this site. Such intellectual property remains the property of its respective owners, and any references here are made solely for identification or informational purposes, without implying any affiliation, endorsement, or partnership.
We make no representations or warranties, express or implied, regarding the accuracy, completeness, or suitability of any content or products presented. Nothing on this website should be construed as legal, tax, investment, financial, medical, or other professional advice. In addition, no part of this site—including articles or product references—constitutes a solicitation, recommendation, endorsement, advertisement, or offer to buy or sell any securities, franchises, or other financial instruments, particularly in jurisdictions where such activity would be unlawful.
All content is of a general nature and may not address the specific circumstances of any individual or entity. It is not a substitute for professional advice or services. Any actions you take based on the information provided here are strictly at your own risk. You accept full responsibility for any decisions or outcomes arising from your use of this website and agree to release us from any liability in connection with your use of, or reliance upon, the content or products found herein.