
|
Ezaki Glico Co., Ltd. (2206.T) DCF Valuation |
Fully Editable: Tailor To Your Needs In Excel Or Sheets
Professional Design: Trusted, Industry-Standard Templates
Investor-Approved Valuation Models
MAC/PC Compatible, Fully Unlocked
No Expertise Is Needed; Easy To Follow
Ezaki Glico Co., Ltd. (2206.T) Bundle
Discover the true potential of Ezaki Glico Co., Ltd. (2206T) with our advanced DCF Calculator! Adjust key inputs, explore various scenarios, and evaluate how different assumptions affect Ezaki Glico Co., Ltd. (2206T) valuation – all conveniently within one Excel template.
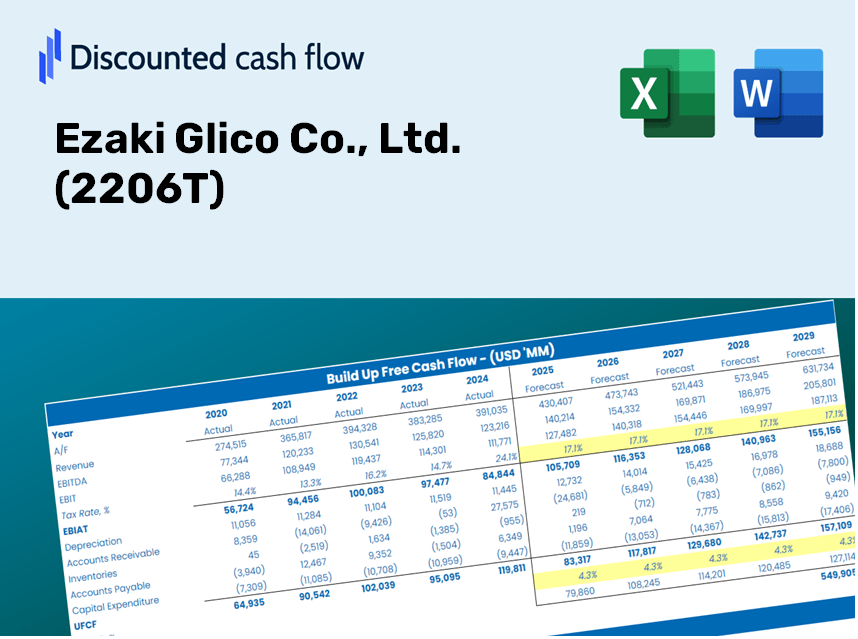
Discounted Cash Flow (DCF) - (USD MM)
| Year | AY1 2020 |
AY2 2021 |
AY3 2022 |
AY4 2023 |
AY5 2024 |
FY1 2025 |
FY2 2026 |
FY3 2027 |
FY4 2028 |
FY5 2029 |
|---|---|---|---|---|---|---|---|---|---|---|
| Revenue | 344,048.0 | 338,571.0 | 303,921.0 | 332,590.0 | 331,129.0 | 328,784.3 | 326,456.2 | 324,144.6 | 321,849.4 | 319,570.4 |
| Revenue Growth, % | 0 | -1.59 | -10.23 | 9.43 | -0.43928 | -0.70809 | -0.70809 | -0.70809 | -0.70809 | -0.70809 |
| EBITDA | 34,356.0 | 35,095.0 | 27,930.0 | 34,052.0 | 29,059.0 | 31,928.6 | 31,702.5 | 31,478.0 | 31,255.1 | 31,033.8 |
| EBITDA, % | 9.99 | 10.37 | 9.19 | 10.24 | 8.78 | 9.71 | 9.71 | 9.71 | 9.71 | 9.71 |
| Depreciation | 14,636.0 | 14,249.0 | 13,896.0 | 14,016.0 | 16,754.0 | 14,669.5 | 14,565.6 | 14,462.5 | 14,360.1 | 14,258.4 |
| Depreciation, % | 4.25 | 4.21 | 4.57 | 4.21 | 5.06 | 4.46 | 4.46 | 4.46 | 4.46 | 4.46 |
| EBIT | 19,720.0 | 20,846.0 | 14,034.0 | 20,036.0 | 12,305.0 | 17,259.1 | 17,136.8 | 17,015.5 | 16,895.0 | 16,775.4 |
| EBIT, % | 5.73 | 6.16 | 4.62 | 6.02 | 3.72 | 5.25 | 5.25 | 5.25 | 5.25 | 5.25 |
| Total Cash | 98,635.0 | 102,245.0 | 91,931.0 | 97,199.0 | 60,243.0 | 89,780.7 | 89,145.0 | 88,513.8 | 87,887.0 | 87,264.7 |
| Total Cash, percent | .0 | .0 | .0 | .0 | .0 | .0 | .0 | .0 | .0 | .0 |
| Account Receivables | 43,462.0 | 42,815.0 | 45,259.0 | 48,335.0 | 49,873.0 | 45,874.9 | 45,550.1 | 45,227.5 | 44,907.3 | 44,589.3 |
| Account Receivables, % | 12.63 | 12.65 | 14.89 | 14.53 | 15.06 | 13.95 | 13.95 | 13.95 | 13.95 | 13.95 |
| Inventories | 28,862.0 | 28,154.0 | 32,845.0 | 33,842.0 | 41,409.0 | 33,004.9 | 32,771.2 | 32,539.1 | 32,308.7 | 32,079.9 |
| Inventories, % | 8.39 | 8.32 | 10.81 | 10.18 | 12.51 | 10.04 | 10.04 | 10.04 | 10.04 | 10.04 |
| Accounts Payable | 32,552.0 | 32,373.0 | 36,430.0 | 38,326.0 | 38,680.0 | 35,649.8 | 35,397.3 | 35,146.7 | 34,897.8 | 34,650.7 |
| Accounts Payable, % | 9.46 | 9.56 | 11.99 | 11.52 | 11.68 | 10.84 | 10.84 | 10.84 | 10.84 | 10.84 |
| Capital Expenditure | -16,744.0 | -23,764.0 | -25,697.0 | -18,377.0 | -17,475.0 | -20,479.1 | -20,334.1 | -20,190.1 | -20,047.1 | -19,905.2 |
| Capital Expenditure, % | -4.87 | -7.02 | -8.46 | -5.53 | -5.28 | -6.23 | -6.23 | -6.23 | -6.23 | -6.23 |
| Tax Rate, % | 33.57 | 33.57 | 33.57 | 33.57 | 33.57 | 33.57 | 33.57 | 33.57 | 33.57 | 33.57 |
| EBITAT | 11,858.2 | 13,545.0 | 8,156.0 | 14,198.9 | 8,174.8 | 11,064.0 | 10,985.6 | 10,907.8 | 10,830.6 | 10,753.9 |
| Depreciation | ||||||||||
| Changes in Account Receivables | ||||||||||
| Changes in Inventories | ||||||||||
| Changes in Accounts Payable | ||||||||||
| Capital Expenditure | ||||||||||
| UFCF | -30,021.8 | 5,206.0 | -6,723.0 | 7,660.9 | -1,297.2 | 14,626.4 | 5,523.3 | 5,484.2 | 5,445.4 | 5,406.8 |
| WACC, % | 4.7 | 4.7 | 4.7 | 4.7 | 4.7 | 4.7 | 4.7 | 4.7 | 4.7 | 4.7 |
| PV UFCF | ||||||||||
| SUM PV UFCF | 32,616.3 | |||||||||
| Long Term Growth Rate, % | 2.00 | |||||||||
| Free cash flow (T + 1) | 5,515 | |||||||||
| Terminal Value | 204,325 | |||||||||
| Present Terminal Value | 162,408 | |||||||||
| Enterprise Value | 195,024 | |||||||||
| Net Debt | -60,078 | |||||||||
| Equity Value | 255,102 | |||||||||
| Diluted Shares Outstanding, MM | 64 | |||||||||
| Equity Value Per Share | 4,009.84 |
What You Will Receive
- Pre-Filled Financial Model: Utilizes Ezaki Glico's actual data for an accurate DCF valuation.
- Comprehensive Forecast Control: Modify revenue growth, profit margins, WACC, and other essential factors.
- Real-Time Calculations: Automatic updates ensure you receive immediate feedback as you make adjustments.
- Professional-Grade Template: An advanced Excel file crafted for high-quality valuation.
- Customizable and Repeatable: Designed for versatility, allowing for extensive use in detailed forecasting.
Key Features
- Customizable Forecast Inputs: Adjust essential variables such as revenue growth, EBITDA %, and capital expenditures for [2206T].
- Instant DCF Valuation: Quickly computes intrinsic value, NPV, and other financial metrics for [2206T].
- High Precision Accuracy: Utilizes Ezaki Glico Co., Ltd.'s actual financial data to deliver realistic valuation results.
- Effortless Scenario Analysis: Easily explore different assumptions and analyze various outcomes for [2206T].
- Efficiency Booster: Save time by avoiding the creation of intricate valuation models from the ground up for [2206T].
How It Functions
- Step 1: Download the Excel spreadsheet.
- Step 2: Examine the pre-filled Glico data (both historical and forecasted).
- Step 3: Modify key assumptions (highlighted in yellow) according to your insights.
- Step 4: Observe the automatic updates reflecting Glico’s intrinsic value.
- Step 5: Utilize the results for investment strategies or reporting purposes.
Why Choose This Calculator for Ezaki Glico Co., Ltd. (2206T)?
- Designed for Professionals: A sophisticated tool utilized by analysts, CFOs, and consultants.
- Comprehensive Data: Historical and projected financials of Ezaki Glico preloaded for precise calculations.
- Flexible Scenario Analysis: Effortlessly simulate various forecasts and assumptions.
- Clear and Concise Outputs: Automatically computes intrinsic value, NPV, and essential metrics.
- User-Friendly: Step-by-step guidance ensures a smooth experience throughout the process.
Who Can Benefit from This Product?
- Investors: Accurately assess Ezaki Glico Co., Ltd.'s fair value prior to making investment choices in [2206T].
- CFOs: Utilize a sophisticated DCF model for enhanced financial reporting and analysis regarding [2206T].
- Consultants: Efficiently customize the template for client valuation reports focused on [2206T].
- Entrepreneurs: Gain valuable insights into financial modeling practices employed by leading companies, including those like Ezaki Glico Co., Ltd. [2206T].
- Educators: Incorporate it as a learning resource to illustrate valuation techniques related to [2206T].
Contents of the Template
- Comprehensive DCF Model: Editable template featuring detailed valuation calculations.
- Real-World Data: Historical and projected financials for Ezaki Glico Co., Ltd. (2206T) included for thorough analysis.
- Customizable Parameters: Modify WACC, growth rates, and tax assumptions to explore various scenarios.
- Financial Statements: Complete annual and quarterly reports for enhanced insights.
- Key Ratios: Integrated analysis for assessing profitability, efficiency, and leverage.
- Dashboard with Visual Outputs: Charts and tables that present clear, actionable results.
Disclaimer
All information, articles, and product details provided on this website are for general informational and educational purposes only. We do not claim any ownership over, nor do we intend to infringe upon, any trademarks, copyrights, logos, brand names, or other intellectual property mentioned or depicted on this site. Such intellectual property remains the property of its respective owners, and any references here are made solely for identification or informational purposes, without implying any affiliation, endorsement, or partnership.
We make no representations or warranties, express or implied, regarding the accuracy, completeness, or suitability of any content or products presented. Nothing on this website should be construed as legal, tax, investment, financial, medical, or other professional advice. In addition, no part of this site—including articles or product references—constitutes a solicitation, recommendation, endorsement, advertisement, or offer to buy or sell any securities, franchises, or other financial instruments, particularly in jurisdictions where such activity would be unlawful.
All content is of a general nature and may not address the specific circumstances of any individual or entity. It is not a substitute for professional advice or services. Any actions you take based on the information provided here are strictly at your own risk. You accept full responsibility for any decisions or outcomes arising from your use of this website and agree to release us from any liability in connection with your use of, or reliance upon, the content or products found herein.