
|
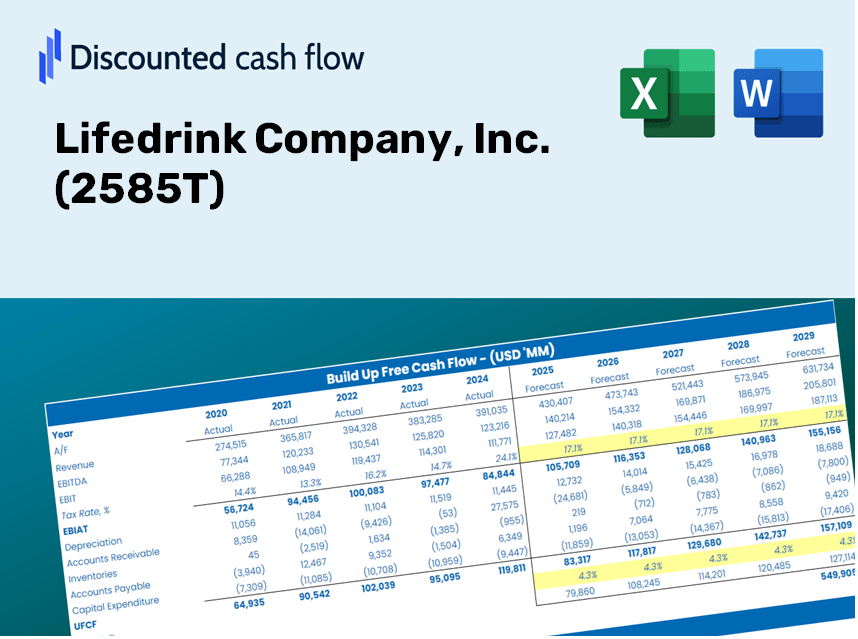
Lifedrink Company, Inc. (2585.T) DCF Valuation |
Fully Editable: Tailor To Your Needs In Excel Or Sheets
Professional Design: Trusted, Industry-Standard Templates
Investor-Approved Valuation Models
MAC/PC Compatible, Fully Unlocked
No Expertise Is Needed; Easy To Follow
Lifedrink Company, Inc. (2585.T) Bundle
Save time and improve precision with our (2585T) DCF Calculator! With accurate Lifedrink Company, Inc. data and customizable assumptions, this tool empowers you to forecast, analyze, and value Lifedrink Company like a seasoned investor.
What You Will Receive
- Authentic LifeDrink Financials: Comprehensive historical and projected data for precise valuation.
- Customizable Inputs: Adjust parameters such as WACC, tax rates, revenue growth, and capital expenditures.
- Real-Time Calculations: Intrinsic value and NPV are computed automatically.
- Scenario Analysis: Evaluate various scenarios to assess the future performance of Lifedrink Company, Inc. (2585T).
- User-Friendly Interface: Designed for professionals while remaining accessible to newcomers.
Core Benefits
- Customizable Forecast Elements: Adjust essential factors such as sales growth, profit margins, and investment expenditures.
- Instant DCF Valuation: Quickly computes intrinsic value, net present value, and additional metrics.
- High-Precision Results: Leverages Lifedrink’s actual financial data for accurate valuation insights.
- Simplified Scenario Planning: Effortlessly evaluate various assumptions and analyze results side by side.
- Efficiency Booster: Streamlines the process, removing the need for intricate valuation models from the ground up.
How It Works
- Step 1: Download the Excel file.
- Step 2: Review Lifedrink Company, Inc.'s pre-filled financial data and forecasts.
- Step 3: Adjust key inputs such as revenue growth, WACC, and tax rates (highlighted cells).
- Step 4: Observe the DCF model automatically update as you modify the assumptions.
- Step 5: Evaluate the outputs and apply the findings to inform your investment decisions.
Why Choose Lifedrink's Calculator?
- Reliable Data: Utilize authentic Lifedrink financials for trustworthy valuation outcomes.
- Tailored Options: Modify essential parameters such as growth rates, WACC, and tax rates to fit your forecasts.
- Efficiency: Pre-configured calculations save you the hassle of building from the ground up.
- Enterprise-Grade Tool: Specifically crafted for investors, analysts, and consultants in the beverage industry.
- Easy to Use: Intuitive design and guided steps make it accessible for every user.
Who Can Benefit from Lifedrink Company, Inc. (2585T)?
- Health-Conscious Individuals: Make informed choices about incorporating Lifedrink products into your wellness routine.
- Nutritional Experts: Enhance dietary recommendations with reliable insights from Lifedrink's offerings.
- Fitness Trainers: Provide clients with valuable hydration solutions tailored to their fitness goals.
- Health Enthusiasts: Gain a deeper understanding of how Lifedrink contributes to overall wellness and performance.
- Students of Nutrition: Explore real-world applications of nutrition science through Lifedrink's product range.
Contents of the Template
- Pre-Filled Data: Contains Lifedrink Company, Inc.’s historical financials and future projections.
- Discounted Cash Flow Model: An editable DCF valuation model featuring automatic calculations.
- Weighted Average Cost of Capital (WACC): A specific sheet to calculate WACC using customizable inputs.
- Key Financial Ratios: Assess Lifedrink’s profitability, efficiency, and leverage.
- Customizable Inputs: Easily modify revenue growth, profit margins, and tax rates.
- Informative Dashboard: Visual summaries including charts and tables for key valuation results.
Disclaimer
All information, articles, and product details provided on this website are for general informational and educational purposes only. We do not claim any ownership over, nor do we intend to infringe upon, any trademarks, copyrights, logos, brand names, or other intellectual property mentioned or depicted on this site. Such intellectual property remains the property of its respective owners, and any references here are made solely for identification or informational purposes, without implying any affiliation, endorsement, or partnership.
We make no representations or warranties, express or implied, regarding the accuracy, completeness, or suitability of any content or products presented. Nothing on this website should be construed as legal, tax, investment, financial, medical, or other professional advice. In addition, no part of this site—including articles or product references—constitutes a solicitation, recommendation, endorsement, advertisement, or offer to buy or sell any securities, franchises, or other financial instruments, particularly in jurisdictions where such activity would be unlawful.
All content is of a general nature and may not address the specific circumstances of any individual or entity. It is not a substitute for professional advice or services. Any actions you take based on the information provided here are strictly at your own risk. You accept full responsibility for any decisions or outcomes arising from your use of this website and agree to release us from any liability in connection with your use of, or reliance upon, the content or products found herein.