
|
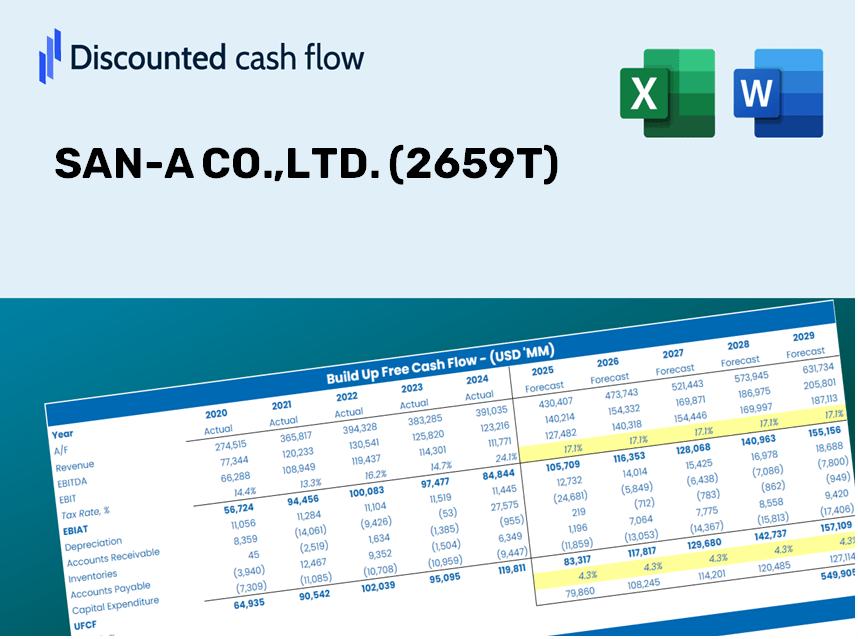
SAN-A CO.,LTD. (2659.T) DCF Valuation |
Fully Editable: Tailor To Your Needs In Excel Or Sheets
Professional Design: Trusted, Industry-Standard Templates
Investor-Approved Valuation Models
MAC/PC Compatible, Fully Unlocked
No Expertise Is Needed; Easy To Follow
SAN-A CO.,Ltd. (2659.T) Bundle
Explore SAN-A CO.,LTD. (2659T) financial outlook with our user-friendly DCF Calculator! Enter your assumptions for growth, margins, and costs to determine SAN-A CO.,LTD. (2659T) intrinsic value and shape your investment strategy.
Discounted Cash Flow (DCF) - (USD MM)
| Year | AY1 2020 |
AY2 2021 |
AY3 2022 |
AY4 2023 |
AY5 2024 |
FY1 2025 |
FY2 2026 |
FY3 2027 |
FY4 2028 |
FY5 2029 |
|---|---|---|---|---|---|---|---|---|---|---|
| Revenue | 202,765.0 | 204,353.0 | 213,521.0 | 227,580.0 | 237,156.0 | 246,678.8 | 256,584.0 | 266,886.9 | 277,603.5 | 288,750.4 |
| Revenue Growth, % | 0 | 0.78317 | 4.49 | 6.58 | 4.21 | 4.02 | 4.02 | 4.02 | 4.02 | 4.02 |
| EBITDA | 17,057.0 | 17,312.0 | 18,718.0 | 22,724.0 | 23,703.0 | 22,511.9 | 23,415.8 | 24,356.0 | 25,334.0 | 26,351.3 |
| EBITDA, % | 8.41 | 8.47 | 8.77 | 9.99 | 9.99 | 9.13 | 9.13 | 9.13 | 9.13 | 9.13 |
| Depreciation | 7,909.0 | 7,510.0 | 7,390.0 | 7,184.0 | 6,669.0 | 8,389.7 | 8,726.6 | 9,077.0 | 9,441.5 | 9,820.6 |
| Depreciation, % | 3.9 | 3.68 | 3.46 | 3.16 | 2.81 | 3.4 | 3.4 | 3.4 | 3.4 | 3.4 |
| EBIT | 9,148.0 | 9,802.0 | 11,328.0 | 15,540.0 | 17,034.0 | 14,122.1 | 14,689.2 | 15,279.0 | 15,892.5 | 16,530.7 |
| EBIT, % | 4.51 | 4.8 | 5.31 | 6.83 | 7.18 | 5.72 | 5.72 | 5.72 | 5.72 | 5.72 |
| Total Cash | 40,124.0 | 31,595.0 | 39,305.0 | 54,848.0 | 59,843.0 | 50,811.7 | 52,852.0 | 54,974.2 | 57,181.6 | 59,477.7 |
| Total Cash, percent | .0 | .0 | .0 | .0 | .0 | .0 | .0 | .0 | .0 | .0 |
| Account Receivables | 5,046.0 | 5,569.0 | 6,327.0 | 7,224.0 | 7,265.0 | 7,111.6 | 7,397.1 | 7,694.1 | 8,003.1 | 8,324.4 |
| Account Receivables, % | 2.49 | 2.73 | 2.96 | 3.17 | 3.06 | 2.88 | 2.88 | 2.88 | 2.88 | 2.88 |
| Inventories | 13,199.0 | 13,108.0 | 14,348.0 | 14,806.0 | 15,655.0 | 16,157.8 | 16,806.6 | 17,481.4 | 18,183.4 | 18,913.5 |
| Inventories, % | 6.51 | 6.41 | 6.72 | 6.51 | 6.6 | 6.55 | 6.55 | 6.55 | 6.55 | 6.55 |
| Accounts Payable | 16,282.0 | 9,460.0 | 10,114.0 | 11,233.0 | 11,651.0 | 13,441.4 | 13,981.1 | 14,542.5 | 15,126.4 | 15,733.8 |
| Accounts Payable, % | 8.03 | 4.63 | 4.74 | 4.94 | 4.91 | 5.45 | 5.45 | 5.45 | 5.45 | 5.45 |
| Capital Expenditure | -6,296.0 | -6,224.0 | -4,933.0 | -3,067.0 | -6,110.0 | -6,110.3 | -6,355.6 | -6,610.8 | -6,876.3 | -7,152.4 |
| Capital Expenditure, % | -3.11 | -3.05 | -2.31 | -1.35 | -2.58 | -2.48 | -2.48 | -2.48 | -2.48 | -2.48 |
| Tax Rate, % | 32.57 | 32.57 | 32.57 | 32.57 | 32.57 | 32.57 | 32.57 | 32.57 | 32.57 | 32.57 |
| EBITAT | 6,072.7 | 6,678.4 | 7,587.1 | 10,701.6 | 11,486.9 | 9,540.7 | 9,923.8 | 10,322.3 | 10,736.7 | 11,167.9 |
| Depreciation | ||||||||||
| Changes in Account Receivables | ||||||||||
| Changes in Inventories | ||||||||||
| Changes in Accounts Payable | ||||||||||
| Capital Expenditure | ||||||||||
| UFCF | 5,722.7 | 710.4 | 8,700.1 | 14,582.6 | 11,573.9 | 13,261.2 | 11,900.1 | 12,377.9 | 12,875.0 | 13,392.0 |
| WACC, % | 4.66 | 4.66 | 4.66 | 4.66 | 4.66 | 4.66 | 4.66 | 4.66 | 4.66 | 4.66 |
| PV UFCF | ||||||||||
| SUM PV UFCF | 55,732.5 | |||||||||
| Long Term Growth Rate, % | 3.00 | |||||||||
| Free cash flow (T + 1) | 13,794 | |||||||||
| Terminal Value | 832,749 | |||||||||
| Present Terminal Value | 663,262 | |||||||||
| Enterprise Value | 718,994 | |||||||||
| Net Debt | -59,566 | |||||||||
| Equity Value | 778,560 | |||||||||
| Diluted Shares Outstanding, MM | 62 | |||||||||
| Equity Value Per Share | 12,591.26 |
What You Will Receive
- Authentic SAN-A Financial Data: Preloaded with SAN-A CO., LTD.'s historical and forecasted data for accurate analysis.
- Customizable Template: Easily adjust critical inputs such as revenue growth, WACC, and EBITDA percentage.
- Instant Calculations: Watch SAN-A's intrinsic value refresh automatically as you make adjustments.
- Expert Valuation Tool: Tailored for investors, analysts, and consultants aiming for precise DCF outcomes.
- Intuitive Interface: Straightforward layout and clear guidance suitable for all levels of expertise.
Key Features of SAN-A CO.,LTD. (2659T)
- Authentic Financial Data: Gain access to precise historical financial figures and future forecasts.
- Adjustable Projection Variables: Modify the highlighted cells for metrics like WACC, growth rates, and profit margins.
- Real-Time Calculations: Enjoy automatic updates for DCF, Net Present Value (NPV), and cash flow assessments.
- User-Friendly Dashboard: View your valuation outcomes through clear charts and concise summaries.
- Designed for All Users: A straightforward and intuitive layout tailored for investors, CFOs, and consultants alike.
How It Works
- Step 1: Download the comprehensive Excel template featuring SAN-A CO.,LTD.'s (2659T) financial data.
- Step 2: Review the pre-filled worksheets to familiarize yourself with the essential metrics.
- Step 3: Adjust forecasts and assumptions in the editable yellow cells (WACC, growth rates, margins).
- Step 4: Instantly access recalculated outputs, including SAN-A CO.,LTD.'s (2659T) intrinsic value.
- Step 5: Use the generated results to make well-informed investment decisions or create detailed reports.
Why Select This Calculator for SAN-A CO., LTD. (2659T)?
- All-in-One Solution: Combines DCF, WACC, and financial ratio analyses into a single resource.
- Flexible Inputs: Modify the yellow-highlighted fields to explore different scenarios.
- In-Depth Analysis: Automatically computes SAN-A's intrinsic value and Net Present Value.
- Data-Rich Environment: Comes with historical and projected data for precise calculations.
- Expert-Level Quality: Perfect for financial analysts, investors, and business advisors.
Who Can Benefit from SAN-A CO., LTD. (2659T)?
- Investors: Make informed choices with a top-tier valuation tool tailored for performance.
- Financial Analysts: Streamline your workflow with a customizable DCF model at your fingertips.
- Consultants: Effortlessly modify the template for impactful client presentations or detailed reports.
- Finance Enthusiasts: Enhance your grasp of valuation strategies through practical, real-life case studies.
- Educators and Students: Utilize this resource as an effective teaching aid in finance-related disciplines.
Overview of the Template Components
- Preloaded SAN-A Data: Historical and projected financial metrics, including revenue, EBIT, and capital expenditures.
- DCF and WACC Models: High-quality worksheets for determining intrinsic value and Weighted Average Cost of Capital.
- Customizable Inputs: Cells highlighted in yellow for modifying revenue growth, tax rates, and discount rates.
- Financial Statements: Detailed annual and quarterly financials for thorough analysis.
- Key Ratios: Profitability, leverage, and efficiency ratios for performance assessment.
- Dashboard and Charts: Visual representations of valuation results and underlying assumptions.
Disclaimer
All information, articles, and product details provided on this website are for general informational and educational purposes only. We do not claim any ownership over, nor do we intend to infringe upon, any trademarks, copyrights, logos, brand names, or other intellectual property mentioned or depicted on this site. Such intellectual property remains the property of its respective owners, and any references here are made solely for identification or informational purposes, without implying any affiliation, endorsement, or partnership.
We make no representations or warranties, express or implied, regarding the accuracy, completeness, or suitability of any content or products presented. Nothing on this website should be construed as legal, tax, investment, financial, medical, or other professional advice. In addition, no part of this site—including articles or product references—constitutes a solicitation, recommendation, endorsement, advertisement, or offer to buy or sell any securities, franchises, or other financial instruments, particularly in jurisdictions where such activity would be unlawful.
All content is of a general nature and may not address the specific circumstances of any individual or entity. It is not a substitute for professional advice or services. Any actions you take based on the information provided here are strictly at your own risk. You accept full responsibility for any decisions or outcomes arising from your use of this website and agree to release us from any liability in connection with your use of, or reliance upon, the content or products found herein.