
|
China Oilfield Services Limited (2883.HK) DCF Valuation |
Fully Editable: Tailor To Your Needs In Excel Or Sheets
Professional Design: Trusted, Industry-Standard Templates
Investor-Approved Valuation Models
MAC/PC Compatible, Fully Unlocked
No Expertise Is Needed; Easy To Follow
China Oilfield Services Limited (2883.HK) Bundle
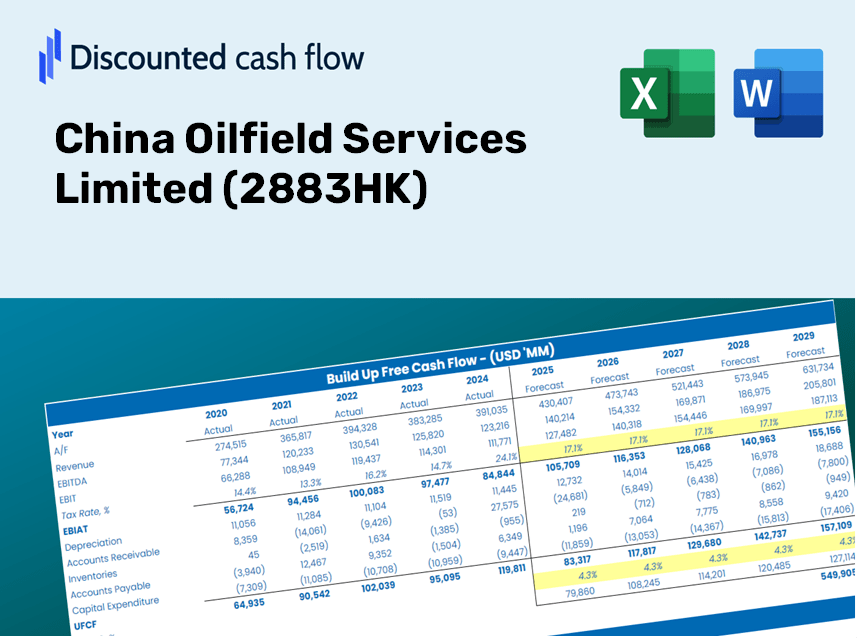
Enhance your investment choices with the China Oilfield Services Limited (2883HK) DCF Calculator! Utilize authentic financial data for China Oilfield Services, adjust growth projections and expenses, and instantly observe how these modifications affect the intrinsic value of China Oilfield Services Limited (2883HK).
Discounted Cash Flow (DCF) - (USD MM)
| Year | AY1 2020 |
AY2 2021 |
AY3 2022 |
AY4 2023 |
AY5 2024 |
FY1 2025 |
FY2 2026 |
FY3 2027 |
FY4 2028 |
FY5 2029 |
|---|---|---|---|---|---|---|---|---|---|---|
| Revenue | 31,736.1 | 32,003.3 | 39,078.2 | 48,338.2 | 52,933.2 | 60,363.8 | 68,837.5 | 78,500.8 | 89,520.5 | 102,087.1 |
| Revenue Growth, % | 0 | 0.84189 | 22.11 | 23.7 | 9.51 | 14.04 | 14.04 | 14.04 | 14.04 | 14.04 |
| EBITDA | 9,262.5 | 6,473.2 | 8,675.3 | 10,688.7 | 11,570.9 | 13,954.2 | 15,913.1 | 18,146.9 | 20,694.3 | 23,599.3 |
| EBITDA, % | 29.19 | 20.23 | 22.2 | 22.11 | 21.86 | 23.12 | 23.12 | 23.12 | 23.12 | 23.12 |
| Depreciation | 4,586.5 | 4,383.2 | 4,571.1 | 4,976.6 | 5,623.2 | 7,335.9 | 8,365.7 | 9,540.1 | 10,879.3 | 12,406.5 |
| Depreciation, % | 14.45 | 13.7 | 11.7 | 10.3 | 10.62 | 12.15 | 12.15 | 12.15 | 12.15 | 12.15 |
| EBIT | 4,676.0 | 2,090.0 | 4,104.2 | 5,712.1 | 5,947.7 | 6,618.3 | 7,547.4 | 8,606.9 | 9,815.1 | 11,192.9 |
| EBIT, % | 14.73 | 6.53 | 10.5 | 11.82 | 11.24 | 10.96 | 10.96 | 10.96 | 10.96 | 10.96 |
| Total Cash | 13,289.6 | 11,854.3 | 10,112.1 | 13,935.9 | 12,575.0 | 19,000.0 | 21,667.2 | 24,708.8 | 28,177.3 | 32,132.8 |
| Total Cash, percent | .0 | .0 | .0 | .0 | .0 | .0 | .0 | .0 | .0 | .0 |
| Account Receivables | 11,725.6 | 11,874.4 | 15,750.3 | 16,051.2 | 15,866.2 | 21,433.4 | 24,442.2 | 27,873.3 | 31,786.1 | 36,248.1 |
| Account Receivables, % | 36.95 | 37.1 | 40.3 | 33.21 | 29.97 | 35.51 | 35.51 | 35.51 | 35.51 | 35.51 |
| Inventories | 2,482.5 | 2,876.6 | 2,823.3 | 2,597.5 | 2,516.7 | 4,124.4 | 4,703.4 | 5,363.7 | 6,116.6 | 6,975.2 |
| Inventories, % | 7.82 | 8.99 | 7.22 | 5.37 | 4.75 | 6.83 | 6.83 | 6.83 | 6.83 | 6.83 |
| Accounts Payable | 9,695.3 | 1,552.0 | 1,907.3 | 5,251.5 | 16,893.4 | 10,027.5 | 11,435.1 | 13,040.3 | 14,870.9 | 16,958.4 |
| Accounts Payable, % | 30.55 | 4.85 | 4.88 | 10.86 | 31.91 | 16.61 | 16.61 | 16.61 | 16.61 | 16.61 |
| Capital Expenditure | -4,582.9 | -4,111.8 | -4,539.5 | -10,382.2 | -6,609.4 | -8,797.4 | -10,032.3 | -11,440.6 | -13,046.6 | -14,878.1 |
| Capital Expenditure, % | -14.44 | -12.85 | -11.62 | -21.48 | -12.49 | -14.57 | -14.57 | -14.57 | -14.57 | -14.57 |
| Tax Rate, % | 32.79 | 32.79 | 32.79 | 32.79 | 32.79 | 32.79 | 32.79 | 32.79 | 32.79 | 32.79 |
| EBITAT | 3,741.1 | 600.7 | 3,246.9 | 4,056.7 | 3,997.5 | 4,316.4 | 4,922.3 | 5,613.3 | 6,401.2 | 7,299.8 |
| Depreciation | ||||||||||
| Changes in Account Receivables | ||||||||||
| Changes in Inventories | ||||||||||
| Changes in Accounts Payable | ||||||||||
| Capital Expenditure | ||||||||||
| UFCF | -768.2 | -7,813.9 | -188.8 | 1,920.2 | 14,919.1 | -11,186.0 | 1,075.6 | 1,226.5 | 1,398.7 | 1,595.1 |
| WACC, % | 5.65 | 4.8 | 5.64 | 5.5 | 5.44 | 5.41 | 5.41 | 5.41 | 5.41 | 5.41 |
| PV UFCF | ||||||||||
| SUM PV UFCF | -6,238.0 | |||||||||
| Long Term Growth Rate, % | 2.00 | |||||||||
| Free cash flow (T + 1) | 1,627 | |||||||||
| Terminal Value | 47,745 | |||||||||
| Present Terminal Value | 36,692 | |||||||||
| Enterprise Value | 30,454 | |||||||||
| Net Debt | 5,023 | |||||||||
| Equity Value | 25,431 | |||||||||
| Diluted Shares Outstanding, MM | 4,771 | |||||||||
| Equity Value Per Share | 5.33 |
What You Will Receive
- Pre-Filled Financial Model: Leverage China Oilfield Services Limited's actual data for accurate DCF valuation.
- Comprehensive Forecast Control: Modify revenue growth, profit margins, WACC, and other essential factors.
- Real-Time Calculations: Instant updates ensure you witness results as you make adjustments.
- Professional-Grade Template: A polished Excel file crafted for top-tier valuation processes.
- Flexible and Reusable: Designed for adaptability, enabling repeated use for in-depth forecasting.
Key Features
- Authentic Historical Data for COSL: Includes comprehensive past financials and projections for China Oilfield Services Limited (2883HK).
- Comprehensive Customization Options: Tailor inputs for revenue growth, profit margins, WACC, tax rates, and capital expenditures to fit your analysis.
- Dynamic Valuation Framework: Instantly recalculates Net Present Value (NPV) and intrinsic value with your customized inputs.
- Scenario Analysis Capabilities: Develop various forecasting scenarios to explore different valuation possibilities.
- Intuitive User Interface: Designed for ease of use, appealing to both professionals and newcomers.
How It Functions
- Download: Obtain the pre-formatted Excel sheet containing financial data for China Oilfield Services Limited (2883HK).
- Customize: Modify projections such as revenue growth, EBITDA %, and WACC as needed.
- Update in Real-Time: Watch as the intrinsic value and NPV calculations adjust automatically.
- Explore Scenarios: Develop various forecasts and instantly compare their results.
- Make Informed Choices: Leverage the valuation insights to shape your investment approach.
Why Opt for This Calculator for China Oilfield Services Limited (2883HK)?
- Save Time: Skip the hassle of building a DCF model from scratch – it’s pre-configured for your convenience.
- Enhance Accuracy: Dependable financial data and formulas minimize valuation errors.
- Completely Customizable: Adjust the model to align with your unique assumptions and forecasts.
- Simple to Analyze: User-friendly charts and outputs allow for straightforward interpretation of results.
- Endorsed by Professionals: Crafted for experts who prioritize both precision and ease of use.
Who Can Benefit from This Product?
- Institutional Investors: Develop comprehensive and accurate valuation models for portfolio assessments related to China Oilfield Services Limited (2883HK).
- Corporate Finance Professionals: Evaluate valuation scenarios to inform strategic decisions within their organizations.
- Financial Consultants and Advisors: Deliver precise valuation insights for clients interested in China Oilfield Services Limited (2883HK).
- Students and Educators: Leverage real data to enhance learning and practice in financial modeling.
- Energy Sector Enthusiasts: Gain insights into how companies like China Oilfield Services Limited (2883HK) are valued within the industry.
Contents of the Template
- Pre-Filled DCF Model: Financial data for China Oilfield Services Limited (2883HK) preloaded for immediate application.
- WACC Calculator: Comprehensive calculations for the Weighted Average Cost of Capital.
- Financial Ratios: Assess China Oilfield Services Limited’s (2883HK) profitability, leverage, and operational efficiency.
- Editable Inputs: Modify assumptions like growth rates, profit margins, and CAPEX to align with your scenarios.
- Financial Statements: Access annual and quarterly reports for in-depth analysis.
- Interactive Dashboard: Visually explore key valuation metrics and outcomes effortlessly.
Disclaimer
All information, articles, and product details provided on this website are for general informational and educational purposes only. We do not claim any ownership over, nor do we intend to infringe upon, any trademarks, copyrights, logos, brand names, or other intellectual property mentioned or depicted on this site. Such intellectual property remains the property of its respective owners, and any references here are made solely for identification or informational purposes, without implying any affiliation, endorsement, or partnership.
We make no representations or warranties, express or implied, regarding the accuracy, completeness, or suitability of any content or products presented. Nothing on this website should be construed as legal, tax, investment, financial, medical, or other professional advice. In addition, no part of this site—including articles or product references—constitutes a solicitation, recommendation, endorsement, advertisement, or offer to buy or sell any securities, franchises, or other financial instruments, particularly in jurisdictions where such activity would be unlawful.
All content is of a general nature and may not address the specific circumstances of any individual or entity. It is not a substitute for professional advice or services. Any actions you take based on the information provided here are strictly at your own risk. You accept full responsibility for any decisions or outcomes arising from your use of this website and agree to release us from any liability in connection with your use of, or reliance upon, the content or products found herein.