
|
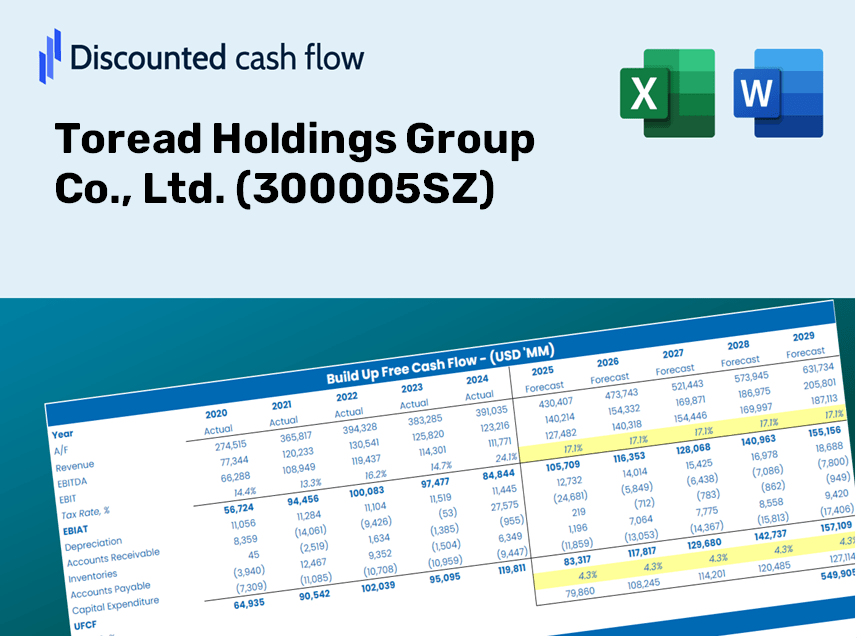
Toread Holdings Group Co., Ltd. (300005.SZ) DCF Valuation |
Fully Editable: Tailor To Your Needs In Excel Or Sheets
Professional Design: Trusted, Industry-Standard Templates
Investor-Approved Valuation Models
MAC/PC Compatible, Fully Unlocked
No Expertise Is Needed; Easy To Follow
Toread Holdings Group Co., Ltd. (300005.SZ) Bundle
Explore the financial prospects of Toread Holdings Group Co., Ltd. (300005SZ) with our user-friendly DCF Calculator! Enter your assumptions regarding growth, margins, and expenses to calculate the intrinsic value of Toread Holdings Group Co., Ltd. (300005SZ) and enhance your investment decisions.
Discounted Cash Flow (DCF) - (USD MM)
| Year | AY1 2020 |
AY2 2021 |
AY3 2022 |
AY4 2023 |
AY5 2024 |
FY1 2025 |
FY2 2026 |
FY3 2027 |
FY4 2028 |
FY5 2029 |
|---|---|---|---|---|---|---|---|---|---|---|
| Revenue | 912.2 | 1,242.7 | 1,139.0 | 1,390.7 | 1,591.6 | 1,848.0 | 2,145.7 | 2,491.3 | 2,892.6 | 3,358.6 |
| Revenue Growth, % | 0 | 36.23 | -8.35 | 22.1 | 14.44 | 16.11 | 16.11 | 16.11 | 16.11 | 16.11 |
| EBITDA | -307.5 | 33.6 | 15.9 | 62.5 | 135.1 | -61.4 | -71.3 | -82.8 | -96.2 | -111.7 |
| EBITDA, % | -33.71 | 2.7 | 1.4 | 4.5 | 8.49 | -3.32 | -3.32 | -3.32 | -3.32 | -3.32 |
| Depreciation | 7.4 | 10.3 | 26.1 | 38.1 | 34.2 | 32.6 | 37.8 | 43.9 | 51.0 | 59.2 |
| Depreciation, % | 0.8104 | 0.82527 | 2.29 | 2.74 | 2.15 | 1.76 | 1.76 | 1.76 | 1.76 | 1.76 |
| EBIT | -314.9 | 23.4 | -10.2 | 24.5 | 100.8 | -94.0 | -109.2 | -126.8 | -147.2 | -170.9 |
| EBIT, % | -34.52 | 1.88 | -0.89606 | 1.76 | 6.34 | -5.09 | -5.09 | -5.09 | -5.09 | -5.09 |
| Total Cash | 1,289.2 | 1,247.3 | 1,183.6 | 1,208.8 | 1,196.2 | 1,707.8 | 1,982.9 | 2,302.3 | 2,673.2 | 3,103.8 |
| Total Cash, percent | .0 | .0 | .0 | .0 | .0 | .0 | .0 | .0 | .0 | .0 |
| Account Receivables | 405.6 | 538.4 | 381.0 | 273.1 | 238.5 | 576.1 | 668.9 | 776.6 | 901.7 | 1,047.0 |
| Account Receivables, % | 44.47 | 43.32 | 33.45 | 19.64 | 14.99 | 31.17 | 31.17 | 31.17 | 31.17 | 31.17 |
| Inventories | 277.9 | 276.5 | 351.1 | 333.1 | 349.1 | 478.4 | 555.4 | 644.9 | 748.8 | 869.4 |
| Inventories, % | 30.47 | 22.25 | 30.83 | 23.95 | 21.93 | 25.89 | 25.89 | 25.89 | 25.89 | 25.89 |
| Accounts Payable | 155.0 | 177.4 | 245.9 | 255.4 | 328.9 | 339.6 | 394.3 | 457.8 | 531.6 | 617.2 |
| Accounts Payable, % | 16.99 | 14.28 | 21.59 | 18.37 | 20.66 | 18.38 | 18.38 | 18.38 | 18.38 | 18.38 |
| Capital Expenditure | -8.5 | -21.4 | -79.4 | -7.1 | -16.3 | -41.2 | -47.8 | -55.6 | -64.5 | -74.9 |
| Capital Expenditure, % | -0.9288 | -1.72 | -6.97 | -0.50874 | -1.02 | -2.23 | -2.23 | -2.23 | -2.23 | -2.23 |
| Tax Rate, % | -2.67 | -2.67 | -2.67 | -2.67 | -2.67 | -2.67 | -2.67 | -2.67 | -2.67 | -2.67 |
| EBITAT | -271.3 | 17.6 | -11.9 | 34.8 | 103.5 | -86.8 | -100.8 | -117.0 | -135.9 | -157.8 |
| Depreciation | ||||||||||
| Changes in Account Receivables | ||||||||||
| Changes in Inventories | ||||||||||
| Changes in Accounts Payable | ||||||||||
| Capital Expenditure | ||||||||||
| UFCF | -800.9 | -102.5 | 86.0 | 201.3 | 213.4 | -551.5 | -226.0 | -262.4 | -304.6 | -353.7 |
| WACC, % | 8.79 | 8.78 | 8.8 | 8.8 | 8.8 | 8.8 | 8.8 | 8.8 | 8.8 | 8.8 |
| PV UFCF | ||||||||||
| SUM PV UFCF | -1,351.0 | |||||||||
| Long Term Growth Rate, % | 4.00 | |||||||||
| Free cash flow (T + 1) | -368 | |||||||||
| Terminal Value | -7,671 | |||||||||
| Present Terminal Value | -5,033 | |||||||||
| Enterprise Value | -6,384 | |||||||||
| Net Debt | -631 | |||||||||
| Equity Value | -5,753 | |||||||||
| Diluted Shares Outstanding, MM | 851 | |||||||||
| Equity Value Per Share | -6.76 |
What You Will Receive
- Authentic 300005SZ Financial Data: Pre-populated with Toread Holdings Group’s historical and forecasted figures for accurate analysis.
- Completely Customizable Template: Easily adjust essential inputs such as revenue growth, WACC, and EBITDA percentage.
- Real-Time Calculations: Watch as the intrinsic value of Toread Holdings updates instantly based on your modifications.
- Expert Valuation Tool: Tailored for investors, analysts, and consultants aiming for precise DCF outcomes.
- Intuitive Layout: Straightforward design and clear guidance suitable for all skill levels.
Key Features
- Pre-Loaded Data: Access to Toread Holdings Group Co., Ltd.'s historical financial statements and pre-filled forecasts.
- Fully Adjustable Inputs: Customize WACC, tax rates, revenue growth, and EBITDA margins.
- Instant Results: View the intrinsic value of Toread Holdings Group Co., Ltd. recalculate in real time.
- Clear Visual Outputs: Dashboard charts present valuation results and essential metrics.
- Built for Accuracy: A professional tool tailored for analysts, investors, and finance experts.
How It Works
- Download: Obtain the pre-formatted Excel file containing Toread Holdings Group Co., Ltd.'s (300005SZ) financial data.
- Customize: Modify key forecasts such as revenue growth, EBITDA percentage, and WACC.
- Update Automatically: Watch as the intrinsic value and NPV calculations refresh in real-time.
- Test Scenarios: Develop various projections and instantly assess the different outcomes.
- Make Decisions: Leverage the valuation findings to inform your investment strategies.
Why Choose the Toread Holdings Group Co., Ltd. Calculator?
- Time Efficient: Our DCF model is pre-built, allowing you to skip lengthy setups.
- Enhanced Accuracy: Access to dependable financial data and formulas minimizes valuation errors.
- Completely Customizable: Adjust the model to align with your specific assumptions and projections.
- User-Friendly: Intuitive charts and outputs provide straightforward analysis of results.
- Endorsed by Professionals: Crafted for experts who prioritize precision and ease of use.
Who Can Benefit from This Product?
- Investors: Evaluate Toread Holdings Group Co., Ltd. (300005SZ) for informed stock trading decisions.
- CFOs and Financial Analysts: Enhance valuation methodologies and assess financial projections.
- Startup Founders: Understand the valuation practices of established companies like Toread Holdings.
- Consultants: Provide comprehensive valuation reports for your clients regarding Toread Holdings Group Co., Ltd. (300005SZ).
- Students and Educators: Access real-world examples to teach and practice valuation strategies.
Contents of the Template
- Preloaded Toread Holdings Data: Historical and projected financial information, including revenue, EBIT, and capital expenditures.
- DCF and WACC Models: Professional-grade spreadsheets for calculating intrinsic value and Weighted Average Cost of Capital.
- Editable Inputs: Yellow-highlighted cells for modifying revenue growth, tax rates, and discount rates.
- Financial Statements: Detailed annual and quarterly financials for comprehensive analysis.
- Key Ratios: Profitability, leverage, and efficiency ratios for performance evaluation.
- Dashboard and Charts: Visual representations of valuation results and underlying assumptions.
Disclaimer
All information, articles, and product details provided on this website are for general informational and educational purposes only. We do not claim any ownership over, nor do we intend to infringe upon, any trademarks, copyrights, logos, brand names, or other intellectual property mentioned or depicted on this site. Such intellectual property remains the property of its respective owners, and any references here are made solely for identification or informational purposes, without implying any affiliation, endorsement, or partnership.
We make no representations or warranties, express or implied, regarding the accuracy, completeness, or suitability of any content or products presented. Nothing on this website should be construed as legal, tax, investment, financial, medical, or other professional advice. In addition, no part of this site—including articles or product references—constitutes a solicitation, recommendation, endorsement, advertisement, or offer to buy or sell any securities, franchises, or other financial instruments, particularly in jurisdictions where such activity would be unlawful.
All content is of a general nature and may not address the specific circumstances of any individual or entity. It is not a substitute for professional advice or services. Any actions you take based on the information provided here are strictly at your own risk. You accept full responsibility for any decisions or outcomes arising from your use of this website and agree to release us from any liability in connection with your use of, or reliance upon, the content or products found herein.