
|
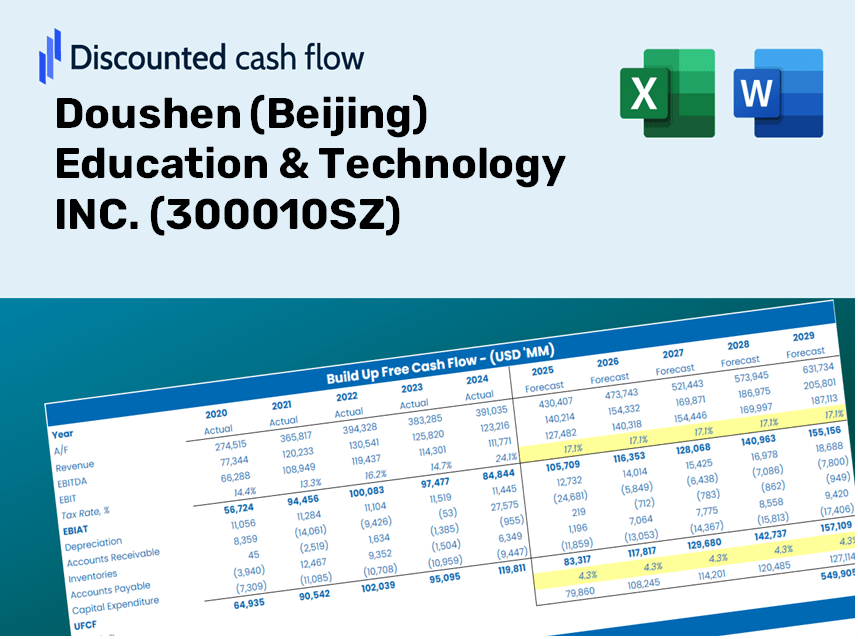
Doushen Education & Technology INC. (300010.SZ) DCF Valuation |
Fully Editable: Tailor To Your Needs In Excel Or Sheets
Professional Design: Trusted, Industry-Standard Templates
Investor-Approved Valuation Models
MAC/PC Compatible, Fully Unlocked
No Expertise Is Needed; Easy To Follow
Doushen (Beijing) Education & Technology INC. (300010.SZ) Bundle
Gain insights into your Doushen (Beijing) Education & Technology INC. (300010SZ) valuation analysis using our sophisticated DCF Calculator! This Excel template is preloaded with real (300010SZ) data, enabling you to adjust forecasts and assumptions to accurately determine the intrinsic value of Doushen (Beijing) Education & Technology INC.
What You Will Receive
- Accurate Doushen Financial Data: Pre-loaded with historical and forecasted figures for in-depth analysis.
- Customizable Template: Easily adjust key metrics such as revenue growth, WACC, and EBITDA %.
- Real-Time Calculations: Instantly view the intrinsic value of Doushen based on your modifications.
- Expert Valuation Tool: Tailored for investors, analysts, and consultants aiming for precise DCF outcomes.
- User-Friendly Interface: Intuitive layout and clear guidance suitable for all skill levels.
Highlighted Features
- Accurate Educational Data: Gain access to reliable pre-loaded historical figures and future forecasts.
- Adjustable Projection Parameters: Modify the highlighted fields, including growth rates, revenue assumptions, and margins.
- Automated Calculations: Real-time updates for revenue projections, Net Present Value (NPV), and financial analyses.
- User-Friendly Dashboard: Intuitive charts and summaries that clearly depict your financial evaluations.
- Designed for All Users: A straightforward, accessible layout tailored for educators, investors, and analysts.
How It Functions
- Step 1: Begin by downloading the Excel file.
- Step 2: Examine the pre-filled financial data and forecasts for Doushen (Beijing) Education & Technology INC. (300010SZ).
- Step 3: Adjust key inputs such as revenue growth, WACC, and tax rates (highlighted cells).
- Step 4: Observe the DCF model update in real time as you modify your assumptions.
- Step 5: Evaluate the outputs and leverage the results for your investment decisions.
Why Opt for Doushen (Beijing) Education & Technology INC. (300010SZ) Calculator?
- Time-Efficient: No need to construct a DCF model from the ground up – it's ready for immediate use.
- Enhanced Accuracy: Dependable financial data and formulas minimize valuation errors.
- Completely Customizable: Adjust the model to mirror your assumptions and forecasts.
- User-Friendly: Intuitive charts and outputs simplify result analysis.
- Preferred by Professionals: Crafted for experts who prioritize precision and functionality.
Who Can Benefit from Doushen (Beijing) Education & Technology INC. (300010SZ)?
- Investors: Make informed decisions with a robust valuation tool tailored for your needs.
- Financial Analysts: Streamline your workflow using a customizable, pre-built DCF model.
- Consultants: Easily modify the template for client presentations and reports.
- Finance Enthusiasts: Enhance your grasp of valuation methodologies with practical, real-world examples.
- Educators and Students: Utilize it as a hands-on resource for finance-related coursework.
What the Template Includes
- Preloaded Doushen Data: Historical and projected financial information, covering revenue, EBIT, and capital expenditures.
- DCF and WACC Models: Professional-grade spreadsheets for determining intrinsic value and Weighted Average Cost of Capital.
- Editable Inputs: Yellow-highlighted cells for modifying revenue growth, tax rates, and discount rates.
- Financial Statements: Detailed annual and quarterly financial records for in-depth analysis.
- Key Ratios: Ratios for profitability, leverage, and efficiency to assess performance.
- Dashboard and Charts: Visual representations of valuation results and underlying assumptions.
Disclaimer
All information, articles, and product details provided on this website are for general informational and educational purposes only. We do not claim any ownership over, nor do we intend to infringe upon, any trademarks, copyrights, logos, brand names, or other intellectual property mentioned or depicted on this site. Such intellectual property remains the property of its respective owners, and any references here are made solely for identification or informational purposes, without implying any affiliation, endorsement, or partnership.
We make no representations or warranties, express or implied, regarding the accuracy, completeness, or suitability of any content or products presented. Nothing on this website should be construed as legal, tax, investment, financial, medical, or other professional advice. In addition, no part of this site—including articles or product references—constitutes a solicitation, recommendation, endorsement, advertisement, or offer to buy or sell any securities, franchises, or other financial instruments, particularly in jurisdictions where such activity would be unlawful.
All content is of a general nature and may not address the specific circumstances of any individual or entity. It is not a substitute for professional advice or services. Any actions you take based on the information provided here are strictly at your own risk. You accept full responsibility for any decisions or outcomes arising from your use of this website and agree to release us from any liability in connection with your use of, or reliance upon, the content or products found herein.