
|
EVE Energy Co., Ltd. (300014.SZ): BCG Matrix |
Fully Editable: Tailor To Your Needs In Excel Or Sheets
Professional Design: Trusted, Industry-Standard Templates
Investor-Approved Valuation Models
MAC/PC Compatible, Fully Unlocked
No Expertise Is Needed; Easy To Follow
EVE Energy Co., Ltd. (300014.SZ) Bundle
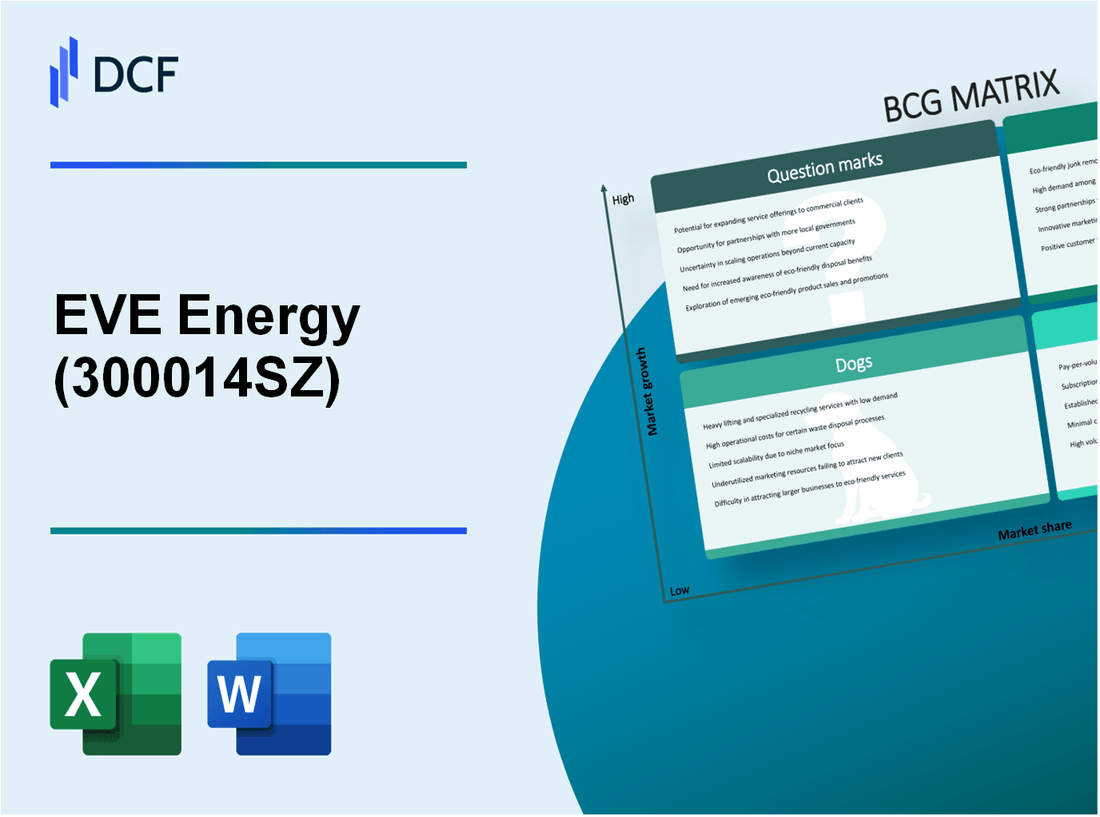
The Boston Consulting Group (BCG) Matrix is a powerful tool for assessing business units and product lines. In the case of EVE Energy Co., Ltd., this analysis reveals a strategic mix of assets ranging from high-potential Stars to lagging Dogs. Understanding where each segment stands can guide investors and stakeholders in making informed decisions. Dive into how EVE Energy harnesses innovation and navigates market challenges in the detailed breakdown below.
Background of EVE Energy Co., Ltd.
EVE Energy Co., Ltd., established in 2001, is a prominent player in the lithium battery industry, primarily focusing on research, development, and production of lithium-ion batteries. The company has become recognized for its innovations in energy storage solutions, aiming to meet the growing demands for clean energy and electric vehicles (EVs). With its headquarters in Huizhou, Guangdong Province, China, EVE has developed a robust manufacturing base equipped with advanced technology.
As of 2023, EVE Energy has expanded its production capacity significantly, with a reported annual output exceeding 30 GWh of lithium batteries. This production scale places EVE among the top battery manufacturers globally, serving markets in electric vehicles, consumer electronics, and energy storage systems. Notably, EVE has formed strategic partnerships with various leading automotive manufacturers, positioning itself as a major supplier for the electric vehicle market.
The company is publicly traded on the Shenzhen Stock Exchange, and as of October 2023, its stock price has experienced notable volatility, reflective of market trends and shifts in the EV sector. EVE Energy's commitment to R&D has resulted in substantial annual investments, typically amounting to over 5% of its revenue, aimed at enhancing battery efficiency and longevity.
Furthermore, EVE's market strategy emphasizes sustainability, aligning with global initiatives for reducing carbon emissions. The company's active engagement in environmental, social, and governance (ESG) practices has garnered attention from investors who prioritize sustainable development.
In terms of financial performance, EVE Energy reported a revenue of approximately ¥14 billion (around $2.2 billion) in 2022, showcasing a year-over-year growth of approximately 30%. This growth trajectory underscores the rising demand for lithium-ion batteries as major economies shift towards greener energy solutions.
Overall, EVE Energy Co., Ltd. has established itself as a dynamic force in the lithium battery market, leveraging innovation and strategic partnerships to capitalize on the accelerating transition to electric mobility and renewable energy.
EVE Energy Co., Ltd. - BCG Matrix: Stars
EVE Energy Co., Ltd. has established itself as a prominent player in the lithium-ion battery market with its high-performance products. The company's focus on innovation has enabled it to capture significant market share in a rapidly growing industry.
High-performance lithium-ion batteries
EVE Energy's high-performance lithium-ion batteries represent a substantial segment of the company's portfolio. In 2022, EVE Energy reported revenues of approximately ¥25.1 billion (about $3.9 billion), with lithium battery sales contributing largely to this figure. Their market share in the lithium battery sector reached around 10% in China, positioning them among the top manufacturers in the country.
The production capacity for these batteries has steadily increased, with EVE Energy targeting a production capacity of 40 GWh by 2025. The company’s investments in production facilities, estimated at ¥6 billion (approximately $930 million), aim to support this growth.
Advanced energy storage solutions
In addition to lithium-ion batteries, EVE Energy has made significant strides in advanced energy storage solutions. As of 2023, the segment generated approximately ¥10.5 billion (about $1.6 billion) in revenue, representing a year-on-year growth rate of 25%. The company holds a competitive market share of approximately 8% in the energy storage market in China.
To facilitate further growth, EVE Energy has announced plans to invest ¥4 billion (around $620 million) in R&D for new energy storage technologies by 2026. This investment aims to enhance their product portfolio and address the increasing demand from renewable energy sectors.
| Year | Revenue (¥ Billion) | Market Share (Lithium-ion Batteries) | Production Capacity (GWh) | Investment in R&D (¥ Billion) |
|---|---|---|---|---|
| 2022 | 25.1 | 10% | Target 40 GWh by 2025 | 6 |
| 2023 | 10.5 | 8% | Expansion ongoing | 4 |
The robust performance of EVE Energy's high-performance lithium-ion batteries and advanced energy storage solutions positions them as Stars within the BCG Matrix. As the demand for energy storage and electric vehicle batteries continues to surge, EVE Energy's strong market presence and substantial investments provide a solid foundation for sustaining growth and transitioning into Cash Cows in the future.
EVE Energy Co., Ltd. - BCG Matrix: Cash Cows
EVE Energy Co., Ltd. has established itself in the lithium battery market, particularly through its standard lithium batteries, which represent a significant cash cow for the company. In 2022, EVE Energy reported a revenue of approximately ¥8.5 billion from its lithium battery segment. The overall market for lithium batteries is projected to grow at a CAGR (Compound Annual Growth Rate) of around 16% from 2023 to 2028; however, EVE's current market share in this mature segment stands at approximately 25%.
Within the lithium battery sector, the company's standard lithium-ion batteries are known for their high profit margins, boasting a margin of around 30%. This efficiency translates into substantial cash flow, essential for funding other units within the company. In the fiscal year 2022, EVE’s operating income from this product line reached nearly ¥2.55 billion, showcasing the strong cash-generating ability of this business unit.
Investment in promotional activities for standard lithium batteries remains relatively low at about 5% of total revenue, fitting the profile of a cash cow. Instead, EVE has chosen to focus more on optimizing production efficiency, with capital expenditures in this segment accounting for approximately ¥500 million in the last financial year. This approach has enhanced supply chain management and production capabilities, ultimately increasing cash flow generation.
Another critical component of EVE's cash cow status is its established automotive partnerships. EVE Energy has collaborated with major automotive manufacturers, including BMW, Volkswagen, and SAIC Motor. These partnerships have solidified the company's position in the market, contributing to a steady revenue stream. For instance, in 2022, revenue from automotive applications generated around ¥3 billion, representing a significant portion of the overall earnings from the lithium battery segment.
| Metrics | 2022 Figures | 2023 Projections |
|---|---|---|
| Revenue from Lithium Batteries | ¥8.5 billion | ¥9.0 billion |
| Operating Income | ¥2.55 billion | ¥2.8 billion |
| Market Share (Lithium Batteries) | 25% | 25% |
| Profit Margin | 30% | 30% |
| Capital Expenditures | ¥500 million | ¥550 million |
| Revenue from Automotive Partnerships | ¥3 billion | ¥3.5 billion |
| Promotional Investment | 5% of Revenue | 5% of Revenue |
Through strategic partnerships and a focus on efficiency, EVE Energy's cash cows not only provide the necessary funding for other ventures but also reinforce its competitive positioning in the marketplace. EVE's ability to leverage these cash-generating units effectively ensures sustainable growth and profitability within its operations.
EVE Energy Co., Ltd. - BCG Matrix: Dogs
Within the context of EVE Energy Co., Ltd., several segments can be categorized as 'Dogs,' reflecting their low market share and growth prospects. These segments often consume financial resources without contributing significantly to overall profitability.
Outdated Battery Technologies
EVE Energy has invested heavily in battery technologies primarily based on nickel-cobalt-manganese (NCM) chemistry. However, the market has shifted towards newer technologies, such as lithium iron phosphate (LFP), which offer better performance and lower costs. As of the latest fiscal year, the company reported 7% of its battery sales coming from these outdated technologies. Their revenue growth for this product segment has stagnated at 0.5% year-over-year, significantly below the industry growth rate of 15%.
The following table outlines the financial performance of EVE's outdated battery technologies, highlighting the challenges faced in this segment:
| Fiscal Year | Revenue (in million CNY) | Growth Rate (%) | Market Share (%) |
|---|---|---|---|
| 2021 | 200 | 1.5 | 5 |
| 2022 | 210 | 0.5 | 4.8 |
| 2023 | 215 | 2.4 | 4.5 |
This data illustrates that despite a slight increase in revenue in 2023, the low growth rate and declining market share indicate a poor outlook for further investment in this technology.
Underperforming Market Segments
EVE Energy's venture into consumer electronics batteries has proven to be underwhelming. Competing against established players, such as Panasonic and Samsung SDI, EVE has captured merely 2% of the global market share in this space as of 2023. The segment has recorded a revenue decline of 10% over the last fiscal year, with total revenue dipping to 100 million CNY.
The following table reflects the performance metrics for EVE's consumer electronics battery segment:
| Fiscal Year | Revenue (in million CNY) | Decline Rate (%) | Market Share (%) |
|---|---|---|---|
| 2021 | 150 | -5 | 3 |
| 2022 | 110 | -27 | 2.5 |
| 2023 | 100 | -10 | 2 |
Given the persistent revenue declines and minimal market share, these underperforming segments are emblematic of the Dogs category. They tie up resources that could be more effectively utilized elsewhere in EVE's operations.
EVE Energy Co., Ltd. - BCG Matrix: Question Marks
The Question Marks category for EVE Energy Co., Ltd. consists of products and initiatives with high growth potential, albeit with a currently low market share. Below are key areas that fall into this category.
Emerging Solid-State Battery Technology
EVE Energy has invested significantly in the development of solid-state battery technology, which is projected to grow at a CAGR of 30% from 2021 to 2030, according to industry reports. While currently holding a 5% market share in this segment, EVE’s R&D expenditures amounted to approximately ¥1.2 billion (around $186 million) in 2022, focusing on overcoming the challenges of scalability and manufacturing efficiency.
| Year | R&D Expenditure (¥) | Market Share (%) | Projected Market Growth Rate (%) |
|---|---|---|---|
| 2022 | 1.2 billion | 5 | 30 |
| 2023 | 1.5 billion | 6 | 30 |
| 2024 | 1.8 billion | 7 | 30 |
New International Market Expansions
EVE Energy's international market penetration strategy is noteworthy. Recent expansion efforts in Southeast Asia and Europe have been met with mixed success. In 2022, international sales contributed to 20% of overall revenues, with notable growth seen in the European market where sales increased by 15%. However, the company maintains only a 4% share in the European battery market, reflecting the aggressive competition.
| Region | 2022 Revenue Contribution (%) | Market Share (%) | Sales Growth (%) |
|---|---|---|---|
| Southeast Asia | 12 | 5 | 20 |
| Europe | 8 | 4 | 15 |
| North America | 5 | 3 | 10 |
Research in Renewable Energy Integration
EVE Energy Co., Ltd. is also actively involved in research concerning renewable energy integration. With an estimated market for energy storage solutions projected to reach $31 billion by 2026, the company's current participation accounts for only about 3% of this market. In 2022, EVE invested approximately ¥800 million (around $124 million) in projects related to this sector, indicating a significant commitment to establishing a foothold in this rapidly evolving market.
| Year | Investment in Renewable Energy (¥) | Market Share (%) | Projected Market Size ($B) |
|---|---|---|---|
| 2022 | 800 million | 3 | 31 |
| 2023 | 1 billion | 4 | 35 |
| 2024 | 1.2 billion | 5 | 40 |
In summary, the initiatives within the Question Marks category for EVE Energy Co., Ltd. reflect a combination of emerging technologies and strategic market expansions, both of which carry potential for growth but require substantial investment and management to optimize market share and profitability.
The BCG Matrix provides a clear picture of EVE Energy Co., Ltd.'s strategic positioning, highlighting its innovation in high-performance batteries while also acknowledging areas for improvement. By leveraging its strengths and addressing weaknesses, EVE Energy is poised to navigate the fluctuating energy market effectively.
[right_small]Disclaimer
All information, articles, and product details provided on this website are for general informational and educational purposes only. We do not claim any ownership over, nor do we intend to infringe upon, any trademarks, copyrights, logos, brand names, or other intellectual property mentioned or depicted on this site. Such intellectual property remains the property of its respective owners, and any references here are made solely for identification or informational purposes, without implying any affiliation, endorsement, or partnership.
We make no representations or warranties, express or implied, regarding the accuracy, completeness, or suitability of any content or products presented. Nothing on this website should be construed as legal, tax, investment, financial, medical, or other professional advice. In addition, no part of this site—including articles or product references—constitutes a solicitation, recommendation, endorsement, advertisement, or offer to buy or sell any securities, franchises, or other financial instruments, particularly in jurisdictions where such activity would be unlawful.
All content is of a general nature and may not address the specific circumstances of any individual or entity. It is not a substitute for professional advice or services. Any actions you take based on the information provided here are strictly at your own risk. You accept full responsibility for any decisions or outcomes arising from your use of this website and agree to release us from any liability in connection with your use of, or reliance upon, the content or products found herein.