
|
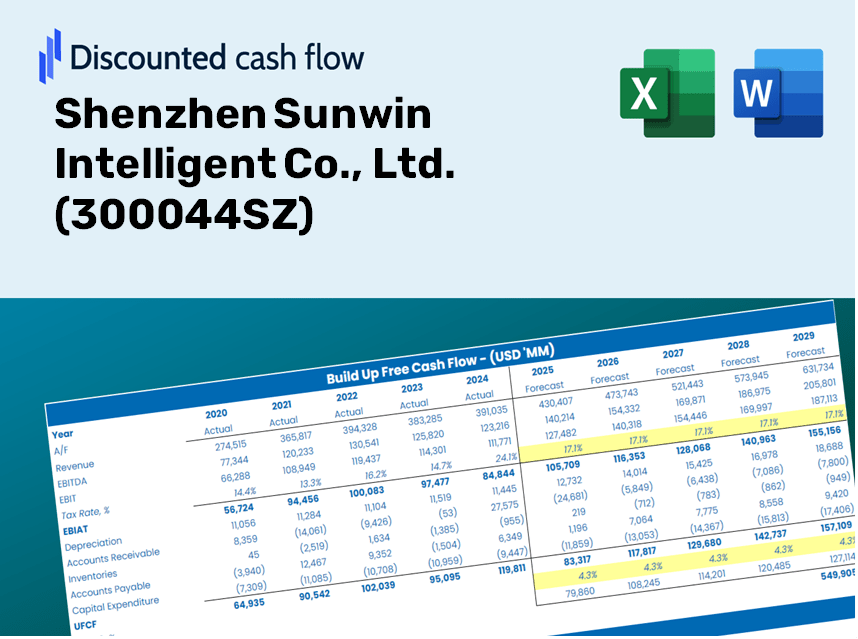
Shenzhen Sunwin Intelligent Co., Ltd. (300044.SZ) DCF Valuation |
Fully Editable: Tailor To Your Needs In Excel Or Sheets
Professional Design: Trusted, Industry-Standard Templates
Investor-Approved Valuation Models
MAC/PC Compatible, Fully Unlocked
No Expertise Is Needed; Easy To Follow
Shenzhen Sunwin Intelligent Co., Ltd. (300044.SZ) Bundle
Enhance your investment strategy with the (300044SZ) DCF Calculator! Explore authentic financial data from Shenzhen Sunwin Intelligent Co., Ltd., adjust growth projections and expenses, and instantly observe how these modifications affect the intrinsic value of the company.
Discounted Cash Flow (DCF) - (USD MM)
| Year | AY1 2020 |
AY2 2021 |
AY3 2022 |
AY4 2023 |
AY5 2024 |
FY1 2025 |
FY2 2026 |
FY3 2027 |
FY4 2028 |
FY5 2029 |
|---|---|---|---|---|---|---|---|---|---|---|
| Revenue | 1,355.4 | 1,032.4 | 386.2 | 448.2 | 143.3 | 93.7 | 61.3 | 40.1 | 26.2 | 17.1 |
| Revenue Growth, % | 0 | -23.83 | -62.59 | 16.04 | -68.03 | -34.6 | -34.6 | -34.6 | -34.6 | -34.6 |
| EBITDA | -340.3 | -151.9 | 11.4 | -69.8 | -436.0 | -28.6 | -18.7 | -12.2 | -8.0 | -5.2 |
| EBITDA, % | -25.11 | -14.72 | 2.95 | -15.57 | -304.33 | -30.49 | -30.49 | -30.49 | -30.49 | -30.49 |
| Depreciation | 84.1 | 87.9 | 78.2 | 64.5 | 47.9 | 15.5 | 10.1 | 6.6 | 4.3 | 2.8 |
| Depreciation, % | 6.21 | 8.52 | 20.24 | 14.4 | 33.45 | 16.56 | 16.56 | 16.56 | 16.56 | 16.56 |
| EBIT | -424.5 | -239.9 | -66.8 | -134.3 | -484.0 | -37.8 | -24.7 | -16.2 | -10.6 | -6.9 |
| EBIT, % | -31.32 | -23.23 | -17.29 | -29.96 | -337.78 | -40.36 | -40.36 | -40.36 | -40.36 | -40.36 |
| Total Cash | 371.8 | 160.6 | 107.2 | 72.7 | 69.1 | 25.3 | 16.6 | 10.8 | 7.1 | 4.6 |
| Total Cash, percent | .0 | .0 | .0 | .0 | .0 | .0 | .0 | .0 | .0 | .0 |
| Account Receivables | 1,169.6 | 1,391.5 | 903.2 | 821.4 | 450.1 | 91.1 | 59.6 | 39.0 | 25.5 | 16.7 |
| Account Receivables, % | 86.29 | 134.79 | 233.87 | 183.28 | 314.14 | 97.26 | 97.26 | 97.26 | 97.26 | 97.26 |
| Inventories | 40.6 | 53.0 | 35.9 | 20.9 | 1.5 | 4.3 | 2.8 | 1.9 | 1.2 | .8 |
| Inventories, % | 3 | 5.13 | 9.29 | 4.65 | 1.03 | 4.62 | 4.62 | 4.62 | 4.62 | 4.62 |
| Accounts Payable | 986.9 | 384.7 | 349.2 | 323.5 | 260.1 | 69.8 | 45.7 | 29.9 | 19.5 | 12.8 |
| Accounts Payable, % | 72.81 | 37.26 | 90.43 | 72.19 | 181.5 | 74.54 | 74.54 | 74.54 | 74.54 | 74.54 |
| Capital Expenditure | -260.9 | -58.9 | -18.7 | -3.4 | -.7 | -5.8 | -3.8 | -2.5 | -1.6 | -1.1 |
| Capital Expenditure, % | -19.25 | -5.71 | -4.85 | -0.76059 | -0.51953 | -6.22 | -6.22 | -6.22 | -6.22 | -6.22 |
| Tax Rate, % | 0.56607 | 0.56607 | 0.56607 | 0.56607 | 0.56607 | 0.56607 | 0.56607 | 0.56607 | 0.56607 | 0.56607 |
| EBITAT | -364.4 | -258.7 | -151.0 | -129.1 | -481.2 | -36.4 | -23.8 | -15.6 | -10.2 | -6.7 |
| Depreciation | ||||||||||
| Changes in Account Receivables | ||||||||||
| Changes in Inventories | ||||||||||
| Changes in Accounts Payable | ||||||||||
| Capital Expenditure | ||||||||||
| UFCF | -764.5 | -1,066.2 | 378.4 | 3.2 | -106.9 | 139.2 | -8.6 | -5.6 | -3.7 | -2.4 |
| WACC, % | 6.11 | 6.22 | 6.22 | 6.19 | 6.22 | 6.19 | 6.19 | 6.19 | 6.19 | 6.19 |
| PV UFCF | ||||||||||
| SUM PV UFCF | 114.1 | |||||||||
| Long Term Growth Rate, % | 2.00 | |||||||||
| Free cash flow (T + 1) | -2 | |||||||||
| Terminal Value | -59 | |||||||||
| Present Terminal Value | -43 | |||||||||
| Enterprise Value | 71 | |||||||||
| Net Debt | 282 | |||||||||
| Equity Value | -212 | |||||||||
| Diluted Shares Outstanding, MM | 764 | |||||||||
| Equity Value Per Share | -0.28 |
What You Will Receive
- Authentic 300044SZ Financial Data: Pre-loaded with Shenzhen Sunwin Intelligent Co., Ltd.'s historical and forecasted data for accurate analysis.
- Completely Customizable Template: Easily adjust crucial inputs such as revenue growth, WACC, and EBITDA percentage.
- Instant Calculations: Watch the intrinsic value of Shenzhen Sunwin Intelligent Co., Ltd. update immediately based on your modifications.
- Professional Valuation Tool: Tailored for investors, analysts, and consultants seeking reliable DCF outcomes.
- User-Friendly Interface: Intuitive layout and straightforward instructions suited for all skill levels.
Key Features
- Real-Time 300044SZ Data: Pre-loaded with Shenzhen Sunwin Intelligent Co., Ltd.'s historical financial metrics and projections for future growth.
- Completely Customizable Inputs: Tailor your assumptions on revenue growth, profit margins, discount rates, tax obligations, and capital expenditures.
- Adaptive Valuation Model: Automatic recalculations of Net Present Value (NPV) and intrinsic value based on your customized inputs.
- Scenario Analysis: Develop various forecast scenarios to evaluate different valuation possibilities.
- Intuitive User Interface: Designed for both professionals and novices, ensuring ease of use and structured navigation.
How It Works
- Step 1: Download the prebuilt Excel template featuring Shenzhen Sunwin Intelligent Co., Ltd.'s (300044SZ) data.
- Step 2: Examine the pre-filled sheets to familiarize yourself with the essential metrics.
- Step 3: Modify forecasts and assumptions in the editable yellow cells (WACC, growth, margins).
- Step 4: Instantly view updated results, including the intrinsic value of Shenzhen Sunwin Intelligent Co., Ltd. (300044SZ).
- Step 5: Make well-informed investment choices or create reports based on the generated outputs.
Why Opt for Shenzhen Sunwin Intelligent Co., Ltd. ([300044SZ])?
- Precision: Rely on authentic financial data for enhanced accuracy.
- Adaptability: Tailored for users to easily adjust and experiment with inputs.
- Efficiency: Eliminate the need to create complex models from the ground up.
- Expert Quality: Crafted with the standards and clarity professionals expect.
- Intuitive Design: User-friendly interface suitable for all experience levels.
Who Should Consider This Product?
- Investors: Precisely assess Shenzhen Sunwin Intelligent Co., Ltd.'s (300044SZ) intrinsic value prior to making investment choices.
- CFOs: Utilize a high-level DCF model for advanced financial analysis and reporting.
- Consultants: Easily tailor the template for client valuation reports.
- Entrepreneurs: Acquire knowledge of the financial modeling techniques employed by leading companies.
- Educators: Implement it as a resource for teaching various valuation methods.
Contents of the Template
- Historical Data: Provides a comprehensive overview of Shenzhen Sunwin Intelligent Co., Ltd.'s past financial performance and baseline forecasts.
- DCF and Levered DCF Models: In-depth templates designed to assess the intrinsic value of Shenzhen Sunwin Intelligent Co., Ltd. (300044SZ).
- WACC Sheet: Pre-calculated metrics for determining the Weighted Average Cost of Capital.
- Editable Inputs: Adjust crucial parameters such as growth rates, EBITDA percentages, and capital expenditure assumptions.
- Quarterly and Annual Statements: A thorough analysis of Shenzhen Sunwin Intelligent Co., Ltd.'s financial statements.
- Interactive Dashboard: Engage with dynamic visualizations of valuation results and future projections.
Disclaimer
All information, articles, and product details provided on this website are for general informational and educational purposes only. We do not claim any ownership over, nor do we intend to infringe upon, any trademarks, copyrights, logos, brand names, or other intellectual property mentioned or depicted on this site. Such intellectual property remains the property of its respective owners, and any references here are made solely for identification or informational purposes, without implying any affiliation, endorsement, or partnership.
We make no representations or warranties, express or implied, regarding the accuracy, completeness, or suitability of any content or products presented. Nothing on this website should be construed as legal, tax, investment, financial, medical, or other professional advice. In addition, no part of this site—including articles or product references—constitutes a solicitation, recommendation, endorsement, advertisement, or offer to buy or sell any securities, franchises, or other financial instruments, particularly in jurisdictions where such activity would be unlawful.
All content is of a general nature and may not address the specific circumstances of any individual or entity. It is not a substitute for professional advice or services. Any actions you take based on the information provided here are strictly at your own risk. You accept full responsibility for any decisions or outcomes arising from your use of this website and agree to release us from any liability in connection with your use of, or reliance upon, the content or products found herein.