
|
Zhuhai Orbita Aerospace Science & Technology Co.,Ltd (300053.SZ) DCF Valuation |
Fully Editable: Tailor To Your Needs In Excel Or Sheets
Professional Design: Trusted, Industry-Standard Templates
Investor-Approved Valuation Models
MAC/PC Compatible, Fully Unlocked
No Expertise Is Needed; Easy To Follow
Zhuhai Orbita Aerospace Science & Technology Co.,Ltd (300053.SZ) Bundle
Discover the true potential of Zhuhai Orbita Aerospace Science & Technology Co.,Ltd (300053SZ) with our advanced DCF Calculator! Adjust key assumptions, explore various scenarios, and evaluate how different factors influence the valuation of Zhuhai Orbita Aerospace Science & Technology Co.,Ltd (300053SZ) – all within one convenient Excel template.
Discounted Cash Flow (DCF) - (USD MM)
| Year | AY1 2020 |
AY2 2021 |
AY3 2022 |
AY4 2023 |
AY5 2024 |
FY1 2025 |
FY2 2026 |
FY3 2027 |
FY4 2028 |
FY5 2029 |
|---|---|---|---|---|---|---|---|---|---|---|
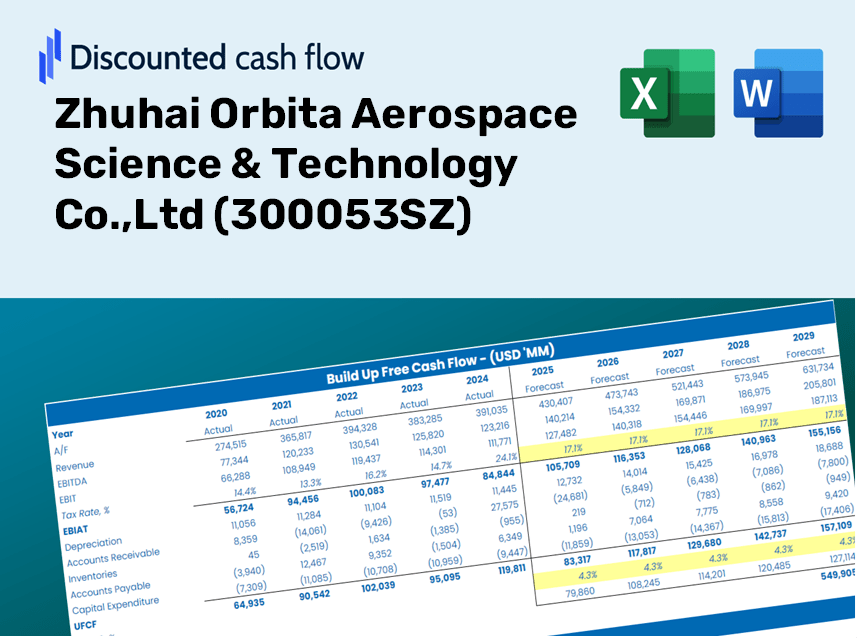
| Revenue | 869.8 | 696.0 | 425.5 | 352.7 | 212.1 | 150.7 | 107.0 | 76.0 | 54.0 | 38.4 |
| Revenue Growth, % | 0 | -19.98 | -38.87 | -17.11 | -39.86 | -28.96 | -28.96 | -28.96 | -28.96 | -28.96 |
| EBITDA | 245.0 | 161.6 | -4.2 | -81.8 | -149.5 | -13.0 | -9.3 | -6.6 | -4.7 | -3.3 |
| EBITDA, % | 28.16 | 23.22 | -0.99854 | -23.2 | -70.49 | -8.66 | -8.66 | -8.66 | -8.66 | -8.66 |
| Depreciation | 173.3 | 132.1 | 141.8 | 115.4 | 80.1 | 43.0 | 30.6 | 21.7 | 15.4 | 11.0 |
| Depreciation, % | 19.93 | 18.98 | 33.32 | 32.73 | 37.77 | 28.55 | 28.55 | 28.55 | 28.55 | 28.55 |
| EBIT | 71.6 | 29.5 | -146.0 | -197.2 | -229.6 | -53.6 | -38.1 | -27.0 | -19.2 | -13.6 |
| EBIT, % | 8.24 | 4.24 | -34.32 | -55.92 | -108.26 | -35.55 | -35.55 | -35.55 | -35.55 | -35.55 |
| Total Cash | 526.6 | 459.5 | 322.4 | 305.0 | 228.6 | 117.2 | 83.2 | 59.1 | 42.0 | 29.8 |
| Total Cash, percent | .0 | .0 | .0 | .0 | .0 | .0 | .0 | .0 | .0 | .0 |
| Account Receivables | 806.6 | 901.7 | 840.0 | 692.6 | 555.3 | 148.5 | 105.5 | 74.9 | 53.2 | 37.8 |
| Account Receivables, % | 92.73 | 129.55 | 197.44 | 196.38 | 261.84 | 98.55 | 98.55 | 98.55 | 98.55 | 98.55 |
| Inventories | 392.0 | 315.0 | 219.6 | 183.5 | 236.8 | 88.6 | 62.9 | 44.7 | 31.8 | 22.6 |
| Inventories, % | 45.06 | 45.25 | 51.62 | 52.04 | 111.66 | 58.8 | 58.8 | 58.8 | 58.8 | 58.8 |
| Accounts Payable | 326.3 | 377.6 | 337.7 | 304.2 | 297.5 | 107.7 | 76.5 | 54.4 | 38.6 | 27.4 |
| Accounts Payable, % | 37.52 | 54.25 | 79.37 | 86.25 | 140.28 | 71.48 | 71.48 | 71.48 | 71.48 | 71.48 |
| Capital Expenditure | -317.7 | -230.6 | -93.0 | -220.6 | -113.1 | -62.5 | -44.4 | -31.5 | -22.4 | -15.9 |
| Capital Expenditure, % | -36.52 | -33.14 | -21.85 | -62.57 | -53.32 | -41.48 | -41.48 | -41.48 | -41.48 | -41.48 |
| Tax Rate, % | -10.57 | -10.57 | -10.57 | -10.57 | -10.57 | -10.57 | -10.57 | -10.57 | -10.57 | -10.57 |
| EBITAT | 61.4 | 29.6 | -126.9 | -200.3 | -253.9 | -50.6 | -36.0 | -25.6 | -18.2 | -12.9 |
| Depreciation | ||||||||||
| Changes in Account Receivables | ||||||||||
| Changes in Inventories | ||||||||||
| Changes in Accounts Payable | ||||||||||
| Capital Expenditure | ||||||||||
| UFCF | -955.3 | -35.8 | 39.0 | -155.5 | -209.5 | 295.1 | -12.3 | -8.8 | -6.2 | -4.4 |
| WACC, % | 4.5 | 4.51 | 4.5 | 4.51 | 4.51 | 4.51 | 4.51 | 4.51 | 4.51 | 4.51 |
| PV UFCF | ||||||||||
| SUM PV UFCF | 254.6 | |||||||||
| Long Term Growth Rate, % | 2.00 | |||||||||
| Free cash flow (T + 1) | -5 | |||||||||
| Terminal Value | -180 | |||||||||
| Present Terminal Value | -144 | |||||||||
| Enterprise Value | 110 | |||||||||
| Net Debt | 70 | |||||||||
| Equity Value | 41 | |||||||||
| Diluted Shares Outstanding, MM | 697 | |||||||||
| Equity Value Per Share | 0.06 |
What You Will Receive
- Authentic Zhuhai Orbita Data: Preloaded financials – encompassing revenue and EBIT – derived from real and forecasted figures.
- Comprehensive Customization: Modify all essential parameters (yellow cells) such as WACC, growth %, and tax rates as needed.
- Immediate Valuation Adjustments: Automatic recalculations to assess the effects of changes on the fair value of Zhuhai Orbita Aerospace (300053SZ).
- Flexible Excel Template: Designed for quick modifications, scenario analysis, and detailed forecasting.
- Efficient and Reliable: Eliminate the need to create models from the ground up while ensuring accuracy and adaptability.
Key Features
- Comprehensive Historical Data: Access to Zhuhai Orbita's past financial statements along with pre-filled projections.
- Customizable Inputs: Adjust metrics such as WACC, tax rates, revenue growth, and EBITDA margins to suit your analysis.
- Real-Time Calculations: Monitor the recalculation of Zhuhai Orbita's intrinsic value instantly.
- Intuitive Visual Representations: Dashboard graphs highlight valuation outcomes and essential performance indicators.
- Designed for Precision: A reliable tool tailored for analysts, investors, and finance professionals.
How It Works
- Download: Get the pre-formatted Excel file featuring Zhuhai Orbita Aerospace's financial data (300053SZ).
- Customize: Modify forecasts, such as revenue growth, EBITDA %, and WACC according to your analysis.
- Update Automatically: The intrinsic value and NPV calculations refresh in real-time.
- Test Scenarios: Develop various projections and evaluate outcomes instantly.
- Make Decisions: Utilize the valuation results to inform your investment approach.
Why Opt for Orbita's Services?
- Efficiency Boost: Skip the hassle of starting from scratch – our solutions are ready to go.
- Enhanced Precision: Our accurate data and methodologies significantly minimize valuation errors.
- Completely Adaptable: Customize our offerings to align with your specific needs and forecasts.
- User-Friendly: Our intuitive charts and outputs simplify data analysis.
- Endorsed by Professionals: Crafted for industry experts who prioritize accuracy and user experience.
Who Can Benefit from This Product?
- Individual Investors: Gain valuable insights for making informed decisions regarding the purchase or sale of Zhuhai Orbita Aerospace Science & Technology Co., Ltd (300053SZ) stock.
- Financial Analysts: Enhance valuation processes with readily available financial models tailored for (300053SZ).
- Consultants: Provide clients with accurate and timely valuation insights for (300053SZ).
- Business Owners: Learn how to assess the valuation of major players like Zhuhai Orbita Aerospace to refine your own business strategies.
- Finance Students: Apply valuation methods using real data and case studies from (300053SZ).
Contents of the Template
- Operating and Balance Sheet Data: Pre-filled historical data and forecasts for Zhuhai Orbita Aerospace Science & Technology Co., Ltd (300053SZ), including metrics such as revenue, EBITDA, EBIT, and capital expenditures.
- WACC Calculation: A specialized sheet for calculating the Weighted Average Cost of Capital (WACC), featuring essential parameters like Beta, risk-free rate, and share price.
- DCF Valuation (Unlevered and Levered): Customizable Discounted Cash Flow models that present intrinsic value along with comprehensive calculations.
- Financial Statements: Pre-loaded financial statements (annual and quarterly) to facilitate thorough analysis.
- Key Ratios: Contains a range of profitability, leverage, and efficiency ratios pertinent to Zhuhai Orbita Aerospace Science & Technology Co., Ltd (300053SZ).
- Dashboard and Charts: A visual overview of valuation outputs and assumptions, designed to simplify the analysis of results.
Disclaimer
All information, articles, and product details provided on this website are for general informational and educational purposes only. We do not claim any ownership over, nor do we intend to infringe upon, any trademarks, copyrights, logos, brand names, or other intellectual property mentioned or depicted on this site. Such intellectual property remains the property of its respective owners, and any references here are made solely for identification or informational purposes, without implying any affiliation, endorsement, or partnership.
We make no representations or warranties, express or implied, regarding the accuracy, completeness, or suitability of any content or products presented. Nothing on this website should be construed as legal, tax, investment, financial, medical, or other professional advice. In addition, no part of this site—including articles or product references—constitutes a solicitation, recommendation, endorsement, advertisement, or offer to buy or sell any securities, franchises, or other financial instruments, particularly in jurisdictions where such activity would be unlawful.
All content is of a general nature and may not address the specific circumstances of any individual or entity. It is not a substitute for professional advice or services. Any actions you take based on the information provided here are strictly at your own risk. You accept full responsibility for any decisions or outcomes arising from your use of this website and agree to release us from any liability in connection with your use of, or reliance upon, the content or products found herein.