
|
East Money Information Co.,Ltd. (300059.SZ) DCF Valuation |
Fully Editable: Tailor To Your Needs In Excel Or Sheets
Professional Design: Trusted, Industry-Standard Templates
Investor-Approved Valuation Models
MAC/PC Compatible, Fully Unlocked
No Expertise Is Needed; Easy To Follow
East Money Information Co.,Ltd. (300059.SZ) Bundle
Looking to determine the intrinsic value of East Money Information Co., Ltd.? Our (300059SZ) DCF Calculator integrates real-world data with extensive customization features, enabling you to refine your forecasts and enhance your investment decisions.
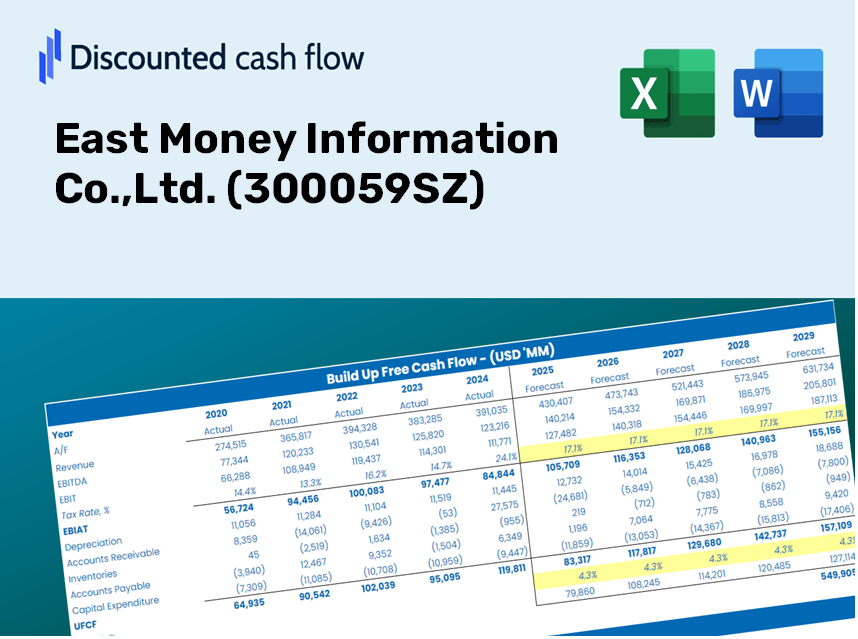
Discounted Cash Flow (DCF) - (USD MM)
| Year | AY1 2020 |
AY2 2021 |
AY3 2022 |
AY4 2023 |
AY5 2024 |
FY1 2025 |
FY2 2026 |
FY3 2027 |
FY4 2028 |
FY5 2029 |
|---|---|---|---|---|---|---|---|---|---|---|
| Revenue | 8,238.6 | 13,094.3 | 12,485.6 | 10,968.8 | 11,604.3 | 12,995.0 | 14,552.4 | 16,296.3 | 18,249.3 | 20,436.3 |
| Revenue Growth, % | 0 | 58.94 | -4.65 | -12.15 | 5.79 | 11.98 | 11.98 | 11.98 | 11.98 | 11.98 |
| EBITDA | 6,246.8 | 10,783.3 | 11,077.1 | 9,875.0 | 11,577.8 | 11,349.7 | 12,709.8 | 14,233.0 | 15,938.7 | 17,848.8 |
| EBITDA, % | 75.82 | 82.35 | 88.72 | 90.03 | 99.77 | 87.34 | 87.34 | 87.34 | 87.34 | 87.34 |
| Depreciation | 4,452.5 | 5,997.8 | 6,188.5 | 487.0 | 449.8 | 4,099.4 | 4,590.7 | 5,140.9 | 5,757.0 | 6,446.9 |
| Depreciation, % | 54.04 | 45.8 | 49.57 | 4.44 | 3.88 | 31.55 | 31.55 | 31.55 | 31.55 | 31.55 |
| EBIT | 1,794.2 | 4,785.4 | 4,888.6 | 9,388.0 | 11,128.0 | 7,250.2 | 8,119.1 | 9,092.1 | 10,181.7 | 11,401.9 |
| EBIT, % | 21.78 | 36.55 | 39.15 | 85.59 | 95.9 | 55.79 | 55.79 | 55.79 | 55.79 | 55.79 |
| Total Cash | 84,324.7 | 136,588.5 | 164,197.7 | 175,951.9 | 233,665.7 | 12,995.0 | 14,552.4 | 16,296.3 | 18,249.3 | 20,436.3 |
| Total Cash, percent | .0 | .0 | .0 | .0 | .0 | .0 | .0 | .0 | .0 | .0 |
| Account Receivables | 42,680.9 | 11,816.6 | 51,976.9 | 22,037.8 | 15,941.9 | 12,741.4 | 14,268.4 | 15,978.3 | 17,893.2 | 20,037.5 |
| Account Receivables, % | 518.06 | 90.24 | 416.3 | 200.91 | 137.38 | 98.05 | 98.05 | 98.05 | 98.05 | 98.05 |
| Inventories | -22,428.6 | -29,326.7 | -20,825.7 | .0 | .0 | -7,797.0 | -8,731.4 | -9,777.8 | -10,949.6 | -12,261.8 |
| Inventories, % | -272.24 | -223.97 | -166.8 | 0 | 0 | -60 | -60 | -60 | -60 | -60 |
| Accounts Payable | 211.0 | 229.0 | 299.1 | 213.7 | 247.3 | 280.3 | 313.9 | 351.5 | 393.6 | 440.8 |
| Accounts Payable, % | 2.56 | 1.75 | 2.4 | 1.95 | 2.13 | 2.16 | 2.16 | 2.16 | 2.16 | 2.16 |
| Capital Expenditure | -276.0 | -1,386.1 | -617.6 | -522.7 | -234.8 | -667.2 | -747.1 | -836.6 | -936.9 | -1,049.2 |
| Capital Expenditure, % | -3.35 | -10.59 | -4.95 | -4.77 | -2.02 | -5.13 | -5.13 | -5.13 | -5.13 | -5.13 |
| Tax Rate, % | 12.92 | 12.92 | 12.92 | 12.92 | 12.92 | 12.92 | 12.92 | 12.92 | 12.92 | 12.92 |
| EBITAT | 1,554.4 | 4,071.0 | 4,252.3 | 8,247.1 | 9,689.8 | 6,287.5 | 7,041.0 | 7,884.8 | 8,829.8 | 9,887.9 |
| Depreciation | ||||||||||
| Changes in Account Receivables | ||||||||||
| Changes in Inventories | ||||||||||
| Changes in Accounts Payable | ||||||||||
| Capital Expenditure | ||||||||||
| UFCF | -14,310.3 | 46,463.1 | -38,768.0 | 17,239.3 | 16,034.3 | 20,750.3 | 10,325.7 | 11,563.1 | 12,948.9 | 14,500.7 |
| WACC, % | 8.26 | 8.25 | 8.26 | 8.27 | 8.26 | 8.26 | 8.26 | 8.26 | 8.26 | 8.26 |
| PV UFCF | ||||||||||
| SUM PV UFCF | 56,269.4 | |||||||||
| Long Term Growth Rate, % | 2.00 | |||||||||
| Free cash flow (T + 1) | 14,791 | |||||||||
| Terminal Value | 236,307 | |||||||||
| Present Terminal Value | 158,912 | |||||||||
| Enterprise Value | 215,181 | |||||||||
| Net Debt | -14,586 | |||||||||
| Equity Value | 229,767 | |||||||||
| Diluted Shares Outstanding, MM | 15,786 | |||||||||
| Equity Value Per Share | 14.56 |
What You Will Receive
- Comprehensive 300059SZ Financials: Features historical and projected data for precise valuation.
- Customizable Inputs: Adjust parameters such as WACC, tax rates, revenue growth, and capital expenditures.
- Instant Calculations: Intrinsic value and NPV are computed automatically.
- Scenario Analysis: Explore various scenarios to assess East Money Information Co., Ltd.'s future performance.
- User-Friendly Interface: Designed for professionals but easy to navigate for newcomers.
Key Features
- Customizable Forecast Inputs: Adjust essential parameters such as revenue growth, EBITDA margin, and capital expenditures.
- Instant DCF Valuation: Automatically computes intrinsic value, net present value (NPV), and various financial metrics.
- High-Precision Accuracy: Leverages East Money Information Co., Ltd.'s (300059SZ) real financial data for reliable valuation results.
- Simplified Scenario Analysis: Easily explore different assumptions and analyze the resulting impacts.
- Efficiency Booster: Avoid the hassle of constructing intricate valuation models from the ground up.
How It Works
- Step 1: Download the prebuilt Excel template featuring East Money Information Co., Ltd.’s (300059SZ) data.
- Step 2: Review the pre-filled sheets to familiarize yourself with the essential metrics.
- Step 3: Adjust forecasts and assumptions in the editable yellow cells (WACC, growth, margins).
- Step 4: Instantly see recalibrated results, including the intrinsic value of East Money Information Co., Ltd. (300059SZ).
- Step 5: Use the outputs to make well-informed investment decisions or to create reports.
Why Opt for This Calculator?
- Designed for Professionals: A sophisticated tool tailored for analysts, CFOs, and consultants in the finance sector.
- Accurate Data: Historical and projected financials of East Money Information Co., Ltd. (300059SZ) are preloaded for precise results.
- Scenario Analysis: Effortlessly test various forecasts and assumptions to see potential outcomes.
- Clear Results: Automatically determines intrinsic value, NPV, and other essential metrics.
- User-Friendly: Step-by-step guidance helps you navigate the process with ease.
Who Can Benefit from This Product?
- Professional Investors: Develop comprehensive and accurate valuation models for portfolio evaluation of East Money Information Co., Ltd. (300059SZ).
- Corporate Finance Teams: Examine valuation scenarios to inform strategic planning within the company.
- Consultants and Advisors: Deliver precise valuation assessments to clients investing in East Money Information Co., Ltd. (300059SZ).
- Students and Educators: Engage with real-world data to enhance financial modeling skills and educational experiences.
- Market Analysts: Gain insights into how companies like East Money Information Co., Ltd. (300059SZ) are evaluated in the financial landscape.
What the Template Contains
- Historical Data: Includes East Money Information Co., Ltd.'s past financials and baseline forecasts.
- DCF and Levered DCF Models: Comprehensive templates for calculating the intrinsic value of East Money Information Co., Ltd. (300059SZ).
- WACC Sheet: Pre-structured calculations for the Weighted Average Cost of Capital.
- Editable Inputs: Customize key drivers such as growth rates, EBITDA %, and CAPEX assumptions.
- Quarterly and Annual Statements: A complete overview of East Money Information Co., Ltd.'s financials.
- Interactive Dashboard: Dynamically visualize valuation results and projections.
Disclaimer
All information, articles, and product details provided on this website are for general informational and educational purposes only. We do not claim any ownership over, nor do we intend to infringe upon, any trademarks, copyrights, logos, brand names, or other intellectual property mentioned or depicted on this site. Such intellectual property remains the property of its respective owners, and any references here are made solely for identification or informational purposes, without implying any affiliation, endorsement, or partnership.
We make no representations or warranties, express or implied, regarding the accuracy, completeness, or suitability of any content or products presented. Nothing on this website should be construed as legal, tax, investment, financial, medical, or other professional advice. In addition, no part of this site—including articles or product references—constitutes a solicitation, recommendation, endorsement, advertisement, or offer to buy or sell any securities, franchises, or other financial instruments, particularly in jurisdictions where such activity would be unlawful.
All content is of a general nature and may not address the specific circumstances of any individual or entity. It is not a substitute for professional advice or services. Any actions you take based on the information provided here are strictly at your own risk. You accept full responsibility for any decisions or outcomes arising from your use of this website and agree to release us from any liability in connection with your use of, or reliance upon, the content or products found herein.