
|
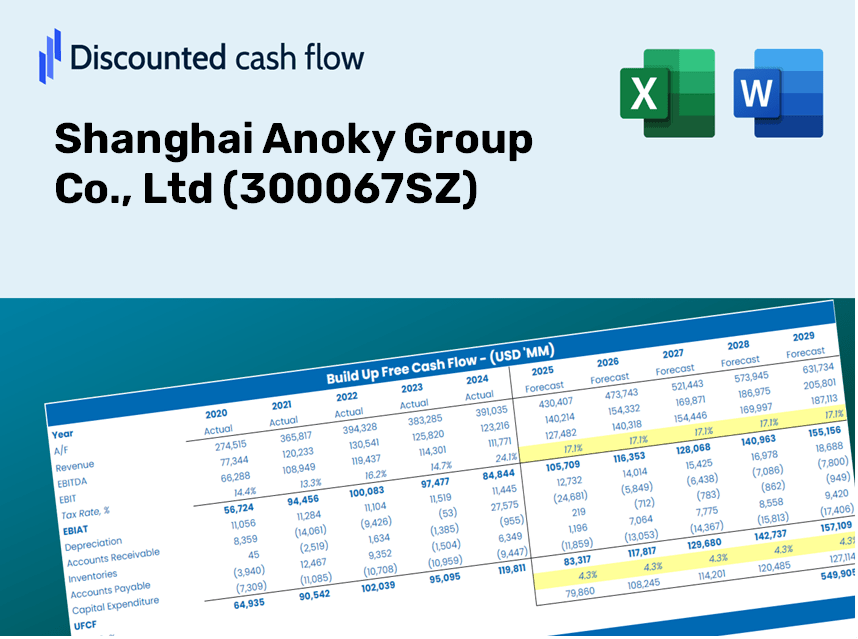
Shanghai Anoky Group Co., Ltd (300067.SZ) DCF Valuation |
Fully Editable: Tailor To Your Needs In Excel Or Sheets
Professional Design: Trusted, Industry-Standard Templates
Investor-Approved Valuation Models
MAC/PC Compatible, Fully Unlocked
No Expertise Is Needed; Easy To Follow
Shanghai Anoky Group Co., Ltd (300067.SZ) Bundle
Engineered for accuracy, our (300067SZ) DCF Calculator allows you to evaluate the valuation of Shanghai Anoky Group Co., Ltd with up-to-date financial information and complete flexibility to modify all essential parameters for enhanced projections.
Discounted Cash Flow (DCF) - (USD MM)
| Year | AY1 2020 |
AY2 2021 |
AY3 2022 |
AY4 2023 |
AY5 2024 |
FY1 2025 |
FY2 2026 |
FY3 2027 |
FY4 2028 |
FY5 2029 |
|---|---|---|---|---|---|---|---|---|---|---|
| Revenue | 995.0 | 1,052.0 | 751.4 | 809.0 | 973.5 | 986.0 | 998.6 | 1,011.5 | 1,024.5 | 1,037.6 |
| Revenue Growth, % | 0 | 5.72 | -28.57 | 7.67 | 20.32 | 1.29 | 1.29 | 1.29 | 1.29 | 1.29 |
| EBITDA | 208.8 | 178.5 | 113.4 | 75.3 | 94.2 | 142.0 | 143.9 | 145.7 | 147.6 | 149.5 |
| EBITDA, % | 20.99 | 16.97 | 15.09 | 9.31 | 9.67 | 14.41 | 14.41 | 14.41 | 14.41 | 14.41 |
| Depreciation | 52.3 | 56.7 | 65.4 | 58.6 | 73.8 | 67.4 | 68.2 | 69.1 | 70.0 | 70.9 |
| Depreciation, % | 5.26 | 5.39 | 8.7 | 7.24 | 7.58 | 6.83 | 6.83 | 6.83 | 6.83 | 6.83 |
| EBIT | 156.5 | 121.8 | 48.0 | 16.7 | 20.4 | 74.6 | 75.6 | 76.6 | 77.6 | 78.6 |
| EBIT, % | 15.73 | 11.58 | 6.38 | 2.06 | 2.09 | 7.57 | 7.57 | 7.57 | 7.57 | 7.57 |
| Total Cash | 231.9 | 472.7 | 335.4 | 274.3 | 141.2 | 318.0 | 322.1 | 326.3 | 330.5 | 334.7 |
| Total Cash, percent | .0 | .0 | .0 | .0 | .0 | .0 | .0 | .0 | .0 | .0 |
| Account Receivables | 423.0 | 397.3 | 416.1 | 433.7 | 503.1 | 475.1 | 481.2 | 487.4 | 493.7 | 500.0 |
| Account Receivables, % | 42.51 | 37.77 | 55.38 | 53.61 | 51.68 | 48.19 | 48.19 | 48.19 | 48.19 | 48.19 |
| Inventories | 478.5 | 406.0 | 498.0 | 394.6 | 419.4 | 482.7 | 489.0 | 495.2 | 501.6 | 508.1 |
| Inventories, % | 48.09 | 38.59 | 66.27 | 48.78 | 43.08 | 48.96 | 48.96 | 48.96 | 48.96 | 48.96 |
| Accounts Payable | 89.1 | 61.9 | 19.9 | 63.0 | 92.1 | 68.5 | 69.4 | 70.3 | 71.2 | 72.1 |
| Accounts Payable, % | 8.95 | 5.89 | 2.64 | 7.79 | 9.46 | 6.95 | 6.95 | 6.95 | 6.95 | 6.95 |
| Capital Expenditure | -213.5 | -195.0 | -265.3 | -277.7 | -238.1 | -264.4 | -267.8 | -271.2 | -274.7 | -278.3 |
| Capital Expenditure, % | -21.45 | -18.53 | -35.31 | -34.32 | -24.46 | -26.82 | -26.82 | -26.82 | -26.82 | -26.82 |
| Tax Rate, % | 180.45 | 180.45 | 180.45 | 180.45 | 180.45 | 180.45 | 180.45 | 180.45 | 180.45 | 180.45 |
| EBITAT | 126.6 | 113.5 | 38.5 | 22.6 | -16.4 | 52.9 | 53.6 | 54.2 | 54.9 | 55.7 |
| Depreciation | ||||||||||
| Changes in Account Receivables | ||||||||||
| Changes in Inventories | ||||||||||
| Changes in Accounts Payable | ||||||||||
| Capital Expenditure | ||||||||||
| UFCF | -847.0 | 46.3 | -314.3 | -67.6 | -245.8 | -203.1 | -157.4 | -159.4 | -161.5 | -163.6 |
| WACC, % | 6.44 | 6.48 | 6.43 | 6.51 | 6.12 | 6.4 | 6.4 | 6.4 | 6.4 | 6.4 |
| PV UFCF | ||||||||||
| SUM PV UFCF | -708.3 | |||||||||
| Long Term Growth Rate, % | 4.00 | |||||||||
| Free cash flow (T + 1) | -170 | |||||||||
| Terminal Value | -7,100 | |||||||||
| Present Terminal Value | -5,208 | |||||||||
| Enterprise Value | -5,916 | |||||||||
| Net Debt | 514 | |||||||||
| Equity Value | -6,430 | |||||||||
| Diluted Shares Outstanding, MM | 1,154 | |||||||||
| Equity Value Per Share | -5.57 |
What You Will Receive
- Authentic Shanghai Anoky Data: Comprehensive financials – from revenue to EBIT – derived from actual and projected figures.
- Complete Customization: Modify all essential parameters (yellow cells) such as WACC, growth %, and tax rates to suit your analysis.
- Real-Time Valuation Updates: Automatic recalibrations to assess the effects of changes on Shanghai Anoky Group’s fair value.
- Flexible Excel Template: Designed for quick modifications, scenario analysis, and thorough projections.
- Efficient and Precise: Eliminate the need to create models from scratch while ensuring accuracy and adaptability.
Key Features
- Comprehensive SHG Data: Includes detailed historical financials and forward-looking projections for Shanghai Anoky Group Co., Ltd (300067SZ).
- Flexible Input Options: Tailor revenue growth, profit margins, weighted average cost of capital (WACC), tax rates, and capital expenditures to your needs.
- Adaptive Valuation Framework: Automatically recalculates Net Present Value (NPV) and intrinsic value based on your adjustments.
- Scenario Analysis: Generate various forecasting scenarios to explore diverse valuation possibilities.
- Intuitive Interface: Designed with simplicity in mind, ensuring accessibility for both professionals and newcomers.
How It Functions
- Download the Template: Gain immediate access to the Excel-based (300067SZ) DCF Calculator.
- Input Your Assumptions: Modify the yellow-highlighted fields for growth rates, WACC, margins, and other parameters.
- Instant Calculations: The model automatically computes the intrinsic value of Shanghai Anoky Group Co., Ltd.
- Test Scenarios: Experiment with various assumptions to assess potential changes in valuation.
- Analyze and Decide: Leverage the outcomes to inform your investment or financial strategies.
Why Choose This Calculator for Shanghai Anoky Group Co., Ltd (300067SZ)?
- All-in-One Solution: Offers DCF, WACC, and financial ratio analyses seamlessly integrated.
- Flexible Inputs: Modify yellow-highlighted cells to explore different financial scenarios.
- In-Depth Analysis: Automatically determines the intrinsic value and Net Present Value for Shanghai Anoky Group Co., Ltd (300067SZ).
- Preloaded Information: Historical and forecasted data provide a solid foundation for calculations.
- High-Quality Standards: Perfect for financial analysts, investors, and business consultants focused on Shanghai Anoky Group Co., Ltd (300067SZ).
Who Should Use This Product?
- Professional Investors: Develop comprehensive and trustworthy valuation models for portfolio assessments of Shanghai Anoky Group Co., Ltd (300067SZ).
- Corporate Finance Teams: Evaluate valuation scenarios to inform strategic decisions within the organization.
- Consultants and Advisors: Offer clients precise valuation insights regarding Shanghai Anoky Group Co., Ltd (300067SZ).
- Students and Educators: Utilize real-world data to enhance learning and practical skills in financial modeling.
- Market Analysts: Gain insights into how companies like Shanghai Anoky Group Co., Ltd (300067SZ) are valued in today's market.
Components of the Template
- Operating and Balance Sheet Data: Pre-populated historical data and forecasts for Shanghai Anoky Group Co., Ltd (300067SZ), including revenue, EBITDA, EBIT, and capital expenditures.
- WACC Calculation: A specific sheet for calculating the Weighted Average Cost of Capital (WACC), featuring parameters such as Beta, risk-free rate, and share price.
- DCF Valuation (Unlevered and Levered): Customizable Discounted Cash Flow models that illustrate intrinsic value through comprehensive calculations.
- Financial Statements: Pre-filled financial statements (both annual and quarterly) to facilitate thorough analysis.
- Key Ratios: Covers profitability, leverage, and efficiency ratios for Shanghai Anoky Group Co., Ltd (300067SZ).
- Dashboard and Charts: A visual overview of valuation outputs and assumptions for easier result analysis.
Disclaimer
All information, articles, and product details provided on this website are for general informational and educational purposes only. We do not claim any ownership over, nor do we intend to infringe upon, any trademarks, copyrights, logos, brand names, or other intellectual property mentioned or depicted on this site. Such intellectual property remains the property of its respective owners, and any references here are made solely for identification or informational purposes, without implying any affiliation, endorsement, or partnership.
We make no representations or warranties, express or implied, regarding the accuracy, completeness, or suitability of any content or products presented. Nothing on this website should be construed as legal, tax, investment, financial, medical, or other professional advice. In addition, no part of this site—including articles or product references—constitutes a solicitation, recommendation, endorsement, advertisement, or offer to buy or sell any securities, franchises, or other financial instruments, particularly in jurisdictions where such activity would be unlawful.
All content is of a general nature and may not address the specific circumstances of any individual or entity. It is not a substitute for professional advice or services. Any actions you take based on the information provided here are strictly at your own risk. You accept full responsibility for any decisions or outcomes arising from your use of this website and agree to release us from any liability in connection with your use of, or reliance upon, the content or products found herein.