
|
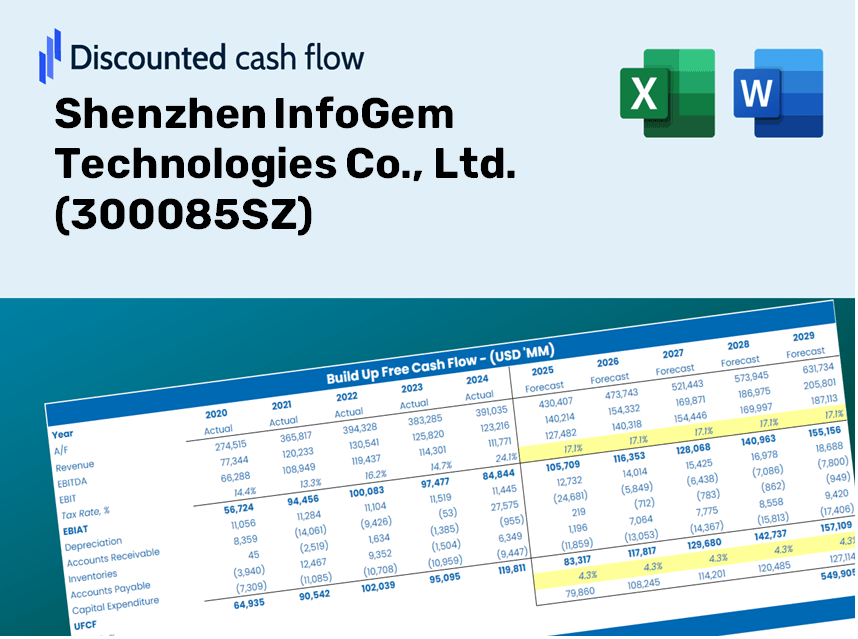
Shenzhen InfoGem Technologies Co., Ltd. (300085.SZ) DCF Valuation |
Fully Editable: Tailor To Your Needs In Excel Or Sheets
Professional Design: Trusted, Industry-Standard Templates
Investor-Approved Valuation Models
MAC/PC Compatible, Fully Unlocked
No Expertise Is Needed; Easy To Follow
Shenzhen InfoGem Technologies Co., Ltd. (300085.SZ) Bundle
Streamline your analysis and improve precision with our (300085SZ) DCF Calculator! Equipped with actual Shenzhen InfoGem Technologies Co., Ltd. data and customizable assumptions, this tool empowers you to forecast, evaluate, and assess (300085SZ) just like a seasoned investor.
Discounted Cash Flow (DCF) - (USD MM)
| Year | AY1 2020 |
AY2 2021 |
AY3 2022 |
AY4 2023 |
AY5 2024 |
FY1 2025 |
FY2 2026 |
FY3 2027 |
FY4 2028 |
FY5 2029 |
|---|---|---|---|---|---|---|---|---|---|---|
| Revenue | 1,390.5 | 1,188.1 | 1,116.2 | 1,015.1 | 862.7 | 766.3 | 680.7 | 604.7 | 537.1 | 477.1 |
| Revenue Growth, % | 0 | -14.55 | -6.05 | -9.06 | -15.02 | -11.17 | -11.17 | -11.17 | -11.17 | -11.17 |
| EBITDA | 85.4 | -212.3 | -70.4 | -56.3 | -26.5 | -40.8 | -36.3 | -32.2 | -28.6 | -25.4 |
| EBITDA, % | 6.14 | -17.87 | -6.3 | -5.55 | -3.07 | -5.33 | -5.33 | -5.33 | -5.33 | -5.33 |
| Depreciation | 26.1 | 38.9 | 37.0 | 39.8 | 32.8 | 24.8 | 22.1 | 19.6 | 17.4 | 15.5 |
| Depreciation, % | 1.88 | 3.27 | 3.32 | 3.92 | 3.81 | 3.24 | 3.24 | 3.24 | 3.24 | 3.24 |
| EBIT | 59.3 | -251.2 | -107.4 | -96.1 | -59.3 | -65.7 | -58.3 | -51.8 | -46.0 | -40.9 |
| EBIT, % | 4.26 | -21.14 | -9.62 | -9.47 | -6.87 | -8.57 | -8.57 | -8.57 | -8.57 | -8.57 |
| Total Cash | 562.4 | 462.9 | 275.0 | 496.1 | 275.0 | 283.2 | 251.6 | 223.5 | 198.5 | 176.3 |
| Total Cash, percent | .0 | .0 | .0 | .0 | .0 | .0 | .0 | .0 | .0 | .0 |
| Account Receivables | 449.0 | 279.9 | 309.6 | 241.7 | 211.1 | 202.1 | 179.5 | 159.5 | 141.7 | 125.8 |
| Account Receivables, % | 32.29 | 23.56 | 27.73 | 23.81 | 24.47 | 26.37 | 26.37 | 26.37 | 26.37 | 26.37 |
| Inventories | 118.9 | 136.2 | 101.3 | 100.8 | 106.9 | 78.8 | 70.0 | 62.2 | 55.2 | 49.1 |
| Inventories, % | 8.55 | 11.46 | 9.07 | 9.93 | 12.39 | 10.28 | 10.28 | 10.28 | 10.28 | 10.28 |
| Accounts Payable | 110.2 | 98.8 | 66.4 | 170.4 | 128.2 | 82.5 | 73.3 | 65.1 | 57.8 | 51.4 |
| Accounts Payable, % | 7.93 | 8.32 | 5.95 | 16.79 | 14.86 | 10.77 | 10.77 | 10.77 | 10.77 | 10.77 |
| Capital Expenditure | -22.6 | -26.5 | -26.0 | -28.8 | -11.8 | -15.9 | -14.1 | -12.6 | -11.2 | -9.9 |
| Capital Expenditure, % | -1.63 | -2.23 | -2.33 | -2.84 | -1.37 | -2.08 | -2.08 | -2.08 | -2.08 | -2.08 |
| Tax Rate, % | -16.46 | -16.46 | -16.46 | -16.46 | -16.46 | -16.46 | -16.46 | -16.46 | -16.46 | -16.46 |
| EBITAT | 69.5 | -242.7 | -105.5 | -100.5 | -69.1 | -65.0 | -57.7 | -51.3 | -45.5 | -40.5 |
| Depreciation | ||||||||||
| Changes in Account Receivables | ||||||||||
| Changes in Inventories | ||||||||||
| Changes in Accounts Payable | ||||||||||
| Capital Expenditure | ||||||||||
| UFCF | -384.7 | -89.8 | -121.6 | 82.9 | -65.7 | -64.6 | -27.6 | -24.6 | -21.8 | -19.4 |
| WACC, % | 11.62 | 11.62 | 11.62 | 11.62 | 11.62 | 11.62 | 11.62 | 11.62 | 11.62 | 11.62 |
| PV UFCF | ||||||||||
| SUM PV UFCF | -123.0 | |||||||||
| Long Term Growth Rate, % | 4.00 | |||||||||
| Free cash flow (T + 1) | -20 | |||||||||
| Terminal Value | -264 | |||||||||
| Present Terminal Value | -153 | |||||||||
| Enterprise Value | -276 | |||||||||
| Net Debt | -3 | |||||||||
| Equity Value | -273 | |||||||||
| Diluted Shares Outstanding, MM | 707 | |||||||||
| Equity Value Per Share | -0.39 |
Your Benefits
- Adjustable Forecast Parameters: Flexibly modify assumptions (growth %, margins, WACC) to explore various scenarios.
- Industry-Specific Data: Shenzhen InfoGem Technologies Co., Ltd.'s (300085SZ) financial information pre-loaded to facilitate your analysis.
- Instant DCF Calculations: The template automatically computes Net Present Value (NPV) and intrinsic value for you.
- Customizable and Professional Design: A sleek Excel model tailored to meet your valuation requirements.
- Designed for Analysts and Investors: Perfect for evaluating projections, confirming strategies, and enhancing efficiency.
Key Features
- Customizable Financial Inputs: Adjust essential components such as revenue growth, EBITDA %, and capital investments.
- Instant DCF Valuation: Quickly computes intrinsic value, NPV, and additional financial metrics.
- High-Precision Accuracy: Leverages Shenzhen InfoGem Technologies Co., Ltd.'s (300085SZ) actual financial data for reliable valuation results.
- Simplified Scenario Analysis: Effortlessly explore various assumptions and assess their impact.
- Efficient Valuation Tool: Save time by avoiding the need to create intricate valuation models from the ground up.
How It Works
- Step 1: Download the Excel file for Shenzhen InfoGem Technologies Co., Ltd. (300085SZ).
- Step 2: Examine the pre-filled financial data and forecasts related to Shenzhen InfoGem Technologies.
- Step 3: Adjust key inputs such as revenue growth, WACC, and tax rates (highlighted cells).
- Step 4: Observe the DCF model update in real-time as you make changes to your assumptions.
- Step 5: Review the results and utilize the insights for your investment strategies.
Why Choose Our Financial Calculator for Shenzhen InfoGem Technologies Co., Ltd. (300085SZ)?
- Accuracy: Reliably utilizes actual financial data for precision.
- Flexibility: Tailored for users to easily experiment with and adjust parameters.
- Time-Saving: Eliminate the need to construct a DCF model from the ground up.
- Professional-Grade: Engineered with the expertise and functionality expected from CFOs.
- User-Friendly: Intuitive design makes it accessible for users with varying levels of financial knowledge.
Who Should Utilize This Product?
- Investors: Precisely assess the fair value of Shenzhen InfoGem Technologies Co., Ltd. (300085SZ) before making investment decisions.
- CFOs: Utilize a high-quality DCF model for financial reporting and analysis related to Shenzhen InfoGem Technologies Co., Ltd. (300085SZ).
- Consultants: Efficiently modify the template for client valuation reports concerning Shenzhen InfoGem Technologies Co., Ltd. (300085SZ).
- Entrepreneurs: Acquire knowledge of financial modeling techniques employed by leading companies, including Shenzhen InfoGem Technologies Co., Ltd. (300085SZ).
- Educators: Implement it as an educational resource to illustrate valuation methodologies relevant to Shenzhen InfoGem Technologies Co., Ltd. (300085SZ).
Contents of the Template
- Pre-Filled DCF Model: Shenzhen InfoGem Technologies Co., Ltd. (300085SZ) financial data ready for immediate analysis.
- WACC Calculator: Comprehensive calculations for the Weighted Average Cost of Capital.
- Financial Ratios: Analyze Shenzhen InfoGem's profitability, leverage, and operational efficiency.
- Editable Inputs: Modify assumptions regarding growth, profit margins, and capital expenditures to match your scenarios.
- Financial Statements: Access annual and quarterly reports to facilitate in-depth analysis.
- Interactive Dashboard: Effortlessly visualize essential valuation metrics and outcomes.
Disclaimer
All information, articles, and product details provided on this website are for general informational and educational purposes only. We do not claim any ownership over, nor do we intend to infringe upon, any trademarks, copyrights, logos, brand names, or other intellectual property mentioned or depicted on this site. Such intellectual property remains the property of its respective owners, and any references here are made solely for identification or informational purposes, without implying any affiliation, endorsement, or partnership.
We make no representations or warranties, express or implied, regarding the accuracy, completeness, or suitability of any content or products presented. Nothing on this website should be construed as legal, tax, investment, financial, medical, or other professional advice. In addition, no part of this site—including articles or product references—constitutes a solicitation, recommendation, endorsement, advertisement, or offer to buy or sell any securities, franchises, or other financial instruments, particularly in jurisdictions where such activity would be unlawful.
All content is of a general nature and may not address the specific circumstances of any individual or entity. It is not a substitute for professional advice or services. Any actions you take based on the information provided here are strictly at your own risk. You accept full responsibility for any decisions or outcomes arising from your use of this website and agree to release us from any liability in connection with your use of, or reliance upon, the content or products found herein.