
|
Xiamen Changelight Co., Ltd. (300102.SZ) DCF Valuation |
Fully Editable: Tailor To Your Needs In Excel Or Sheets
Professional Design: Trusted, Industry-Standard Templates
Investor-Approved Valuation Models
MAC/PC Compatible, Fully Unlocked
No Expertise Is Needed; Easy To Follow
Xiamen Changelight Co., Ltd. (300102.SZ) Bundle
Designed for accuracy, our (300102SZ) DCF Calculator enables you to evaluate Xiamen Changelight Co., Ltd. valuation using real-world financial data and provides complete flexibility to modify all essential parameters for improved projections.
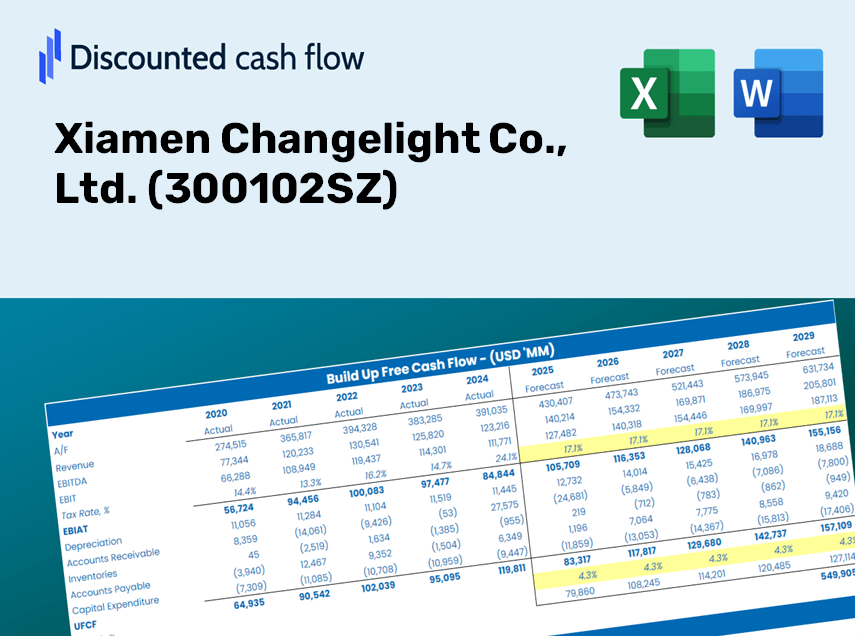
Discounted Cash Flow (DCF) - (USD MM)
| Year | AY1 2020 |
AY2 2021 |
AY3 2022 |
AY4 2023 |
AY5 2024 |
FY1 2025 |
FY2 2026 |
FY3 2027 |
FY4 2028 |
FY5 2029 |
|---|---|---|---|---|---|---|---|---|---|---|
| Revenue | 1,315.7 | 1,879.1 | 1,697.7 | 2,387.4 | 2,432.9 | 2,893.4 | 3,441.0 | 4,092.2 | 4,866.6 | 5,787.6 |
| Revenue Growth, % | 0 | 42.82 | -9.65 | 40.63 | 1.91 | 18.93 | 18.93 | 18.93 | 18.93 | 18.93 |
| EBITDA | 130.2 | 605.7 | 343.8 | 404.9 | 478.7 | 573.0 | 681.4 | 810.4 | 963.7 | 1,146.1 |
| EBITDA, % | 9.9 | 32.23 | 20.25 | 16.96 | 19.68 | 19.8 | 19.8 | 19.8 | 19.8 | 19.8 |
| Depreciation | 381.5 | 389.5 | 389.1 | 415.1 | 411.7 | 618.9 | 736.0 | 875.3 | 1,040.9 | 1,237.9 |
| Depreciation, % | 28.99 | 20.73 | 22.92 | 17.39 | 16.92 | 21.39 | 21.39 | 21.39 | 21.39 | 21.39 |
| EBIT | -251.3 | 216.2 | -45.3 | -10.2 | 67.0 | -45.9 | -54.6 | -64.9 | -77.2 | -91.8 |
| EBIT, % | -19.1 | 11.51 | -2.67 | -0.42668 | 2.75 | -1.59 | -1.59 | -1.59 | -1.59 | -1.59 |
| Total Cash | 511.4 | 427.2 | 1,614.0 | 1,091.6 | 1,126.1 | 1,439.1 | 1,711.4 | 2,035.3 | 2,420.5 | 2,878.6 |
| Total Cash, percent | .0 | .0 | .0 | .0 | .0 | .0 | .0 | .0 | .0 | .0 |
| Account Receivables | 1,086.6 | 1,138.5 | 1,049.1 | 1,330.8 | 1,150.2 | 1,782.3 | 2,119.6 | 2,520.7 | 2,997.7 | 3,565.1 |
| Account Receivables, % | 82.59 | 60.59 | 61.8 | 55.74 | 47.28 | 61.6 | 61.6 | 61.6 | 61.6 | 61.6 |
| Inventories | 366.7 | 464.2 | 536.7 | 478.4 | 574.9 | 739.9 | 879.9 | 1,046.4 | 1,244.4 | 1,480.0 |
| Inventories, % | 27.87 | 24.7 | 31.61 | 20.04 | 23.63 | 25.57 | 25.57 | 25.57 | 25.57 | 25.57 |
| Accounts Payable | 576.3 | 295.9 | 509.4 | 419.7 | 843.5 | 820.6 | 975.9 | 1,160.6 | 1,380.2 | 1,641.4 |
| Accounts Payable, % | 43.8 | 15.75 | 30 | 17.58 | 34.67 | 28.36 | 28.36 | 28.36 | 28.36 | 28.36 |
| Capital Expenditure | -237.1 | -176.9 | -222.6 | -248.0 | -255.3 | -355.5 | -422.8 | -502.8 | -597.9 | -711.1 |
| Capital Expenditure, % | -18.02 | -9.41 | -13.11 | -10.39 | -10.49 | -12.29 | -12.29 | -12.29 | -12.29 | -12.29 |
| Tax Rate, % | -13.83 | -13.83 | -13.83 | -13.83 | -13.83 | -13.83 | -13.83 | -13.83 | -13.83 | -13.83 |
| EBITAT | -208.7 | 198.7 | -33.5 | -32.3 | 76.3 | -41.2 | -49.0 | -58.3 | -69.3 | -82.4 |
| Depreciation | ||||||||||
| Changes in Account Receivables | ||||||||||
| Changes in Inventories | ||||||||||
| Changes in Accounts Payable | ||||||||||
| Capital Expenditure | ||||||||||
| UFCF | -941.4 | -18.5 | 363.3 | -178.4 | 740.6 | -597.8 | -57.8 | -68.8 | -81.8 | -97.2 |
| WACC, % | 4.53 | 4.57 | 4.48 | 4.6 | 4.6 | 4.56 | 4.56 | 4.56 | 4.56 | 4.56 |
| PV UFCF | ||||||||||
| SUM PV UFCF | -831.0 | |||||||||
| Long Term Growth Rate, % | 2.00 | |||||||||
| Free cash flow (T + 1) | -99 | |||||||||
| Terminal Value | -3,880 | |||||||||
| Present Terminal Value | -3,105 | |||||||||
| Enterprise Value | -3,936 | |||||||||
| Net Debt | 352 | |||||||||
| Equity Value | -4,288 | |||||||||
| Diluted Shares Outstanding, MM | 961 | |||||||||
| Equity Value Per Share | -4.46 |
Benefits You Will Receive
- Flexible Forecast Variables: Effortlessly adjust assumptions (growth %, margins, WACC) to explore various scenarios.
- Comprehensive Market Data: Xiamen Changelight Co., Ltd.'s (300102SZ) financial information pre-loaded for immediate analysis.
- Automated DCF Calculations: The template provides calculations for Net Present Value (NPV) and intrinsic value automatically.
- Professional and Customizable: An elegant Excel model tailored to meet your valuation requirements.
- Designed for Analysts and Investors: Perfect for evaluating projections, assessing strategies, and improving efficiency.
Key Features
- Customizable Forecast Parameters: Adjust essential metrics such as revenue growth, EBITDA %, and capital expenditures with ease.
- Instant DCF Valuation: Quickly derives intrinsic value, NPV, and other key outputs automatically.
- High-Precision Accuracy: Harnesses Xiamen Changelight Co., Ltd.'s (300102SZ) actual financial data for credible valuation results.
- Simplified Scenario Analysis: Effortlessly evaluate various assumptions and analyze their impacts.
- Efficiency-Boosting Tool: Remove the hassle of constructing intricate valuation models from the ground up.
How It Works
- Download the Template: Gain immediate access to the Excel-based Xiamen Changelight DCF Calculator for (300102SZ).
- Input Your Assumptions: Modify the yellow-highlighted cells to set your growth rates, WACC, margins, and additional variables.
- Instant Calculations: The model automatically recalibrates the intrinsic value for Xiamen Changelight.
- Test Scenarios: Explore various assumptions to assess how they affect valuation outcomes.
- Analyze and Decide: Leverage the findings to inform your investment or financial strategy.
Why Choose This Calculator for Xiamen Changelight Co., Ltd. (300102SZ)?
- User-Friendly Interface: Perfect for both novices and seasoned professionals.
- Customizable Inputs: Easily adjust parameters to suit your analysis needs.
- Real-Time Valuation: Witness immediate updates to Xiamen Changelight’s valuation as you modify inputs.
- Preloaded Data: Comes with Xiamen Changelight’s actual financial information for quick assessments.
- Relied Upon by Experts: Trusted by investors and analysts for informed decision-making.
Who Can Benefit from Xiamen Changelight Co., Ltd. (300102SZ)?
- Investors: Gain the confidence to make informed decisions with our advanced valuation tools.
- Financial Analysts: Streamline your workflow with our customizable DCF model designed for efficiency.
- Consultants: Effortlessly adjust the template for professional client presentations or reports.
- Finance Enthusiasts: Enhance your grasp of valuation methodologies through practical, real-world scenarios.
- Educators and Students: Utilize our resources as a hands-on learning aid in finance-related studies.
What the Template Includes
- Pre-Filled Data: Contains Xiamen Changelight Co., Ltd.'s historical financials and projections.
- Discounted Cash Flow Model: An editable DCF valuation model with auto-calculating features.
- Weighted Average Cost of Capital (WACC): A dedicated sheet for WACC calculations based on user-defined inputs.
- Key Financial Ratios: Examine Xiamen Changelight's profitability, efficiency, and financial leverage.
- Customizable Inputs: Easily modify revenue growth, profit margins, and tax rates.
- Clear Dashboard: Visual representations and tables summarizing essential valuation findings.
Disclaimer
All information, articles, and product details provided on this website are for general informational and educational purposes only. We do not claim any ownership over, nor do we intend to infringe upon, any trademarks, copyrights, logos, brand names, or other intellectual property mentioned or depicted on this site. Such intellectual property remains the property of its respective owners, and any references here are made solely for identification or informational purposes, without implying any affiliation, endorsement, or partnership.
We make no representations or warranties, express or implied, regarding the accuracy, completeness, or suitability of any content or products presented. Nothing on this website should be construed as legal, tax, investment, financial, medical, or other professional advice. In addition, no part of this site—including articles or product references—constitutes a solicitation, recommendation, endorsement, advertisement, or offer to buy or sell any securities, franchises, or other financial instruments, particularly in jurisdictions where such activity would be unlawful.
All content is of a general nature and may not address the specific circumstances of any individual or entity. It is not a substitute for professional advice or services. Any actions you take based on the information provided here are strictly at your own risk. You accept full responsibility for any decisions or outcomes arising from your use of this website and agree to release us from any liability in connection with your use of, or reliance upon, the content or products found herein.