
|
Anhui Tatfook Technology Co., Ltd (300134.SZ) DCF Valuation |
Fully Editable: Tailor To Your Needs In Excel Or Sheets
Professional Design: Trusted, Industry-Standard Templates
Investor-Approved Valuation Models
MAC/PC Compatible, Fully Unlocked
No Expertise Is Needed; Easy To Follow
Anhui Tatfook Technology Co., Ltd (300134.SZ) Bundle
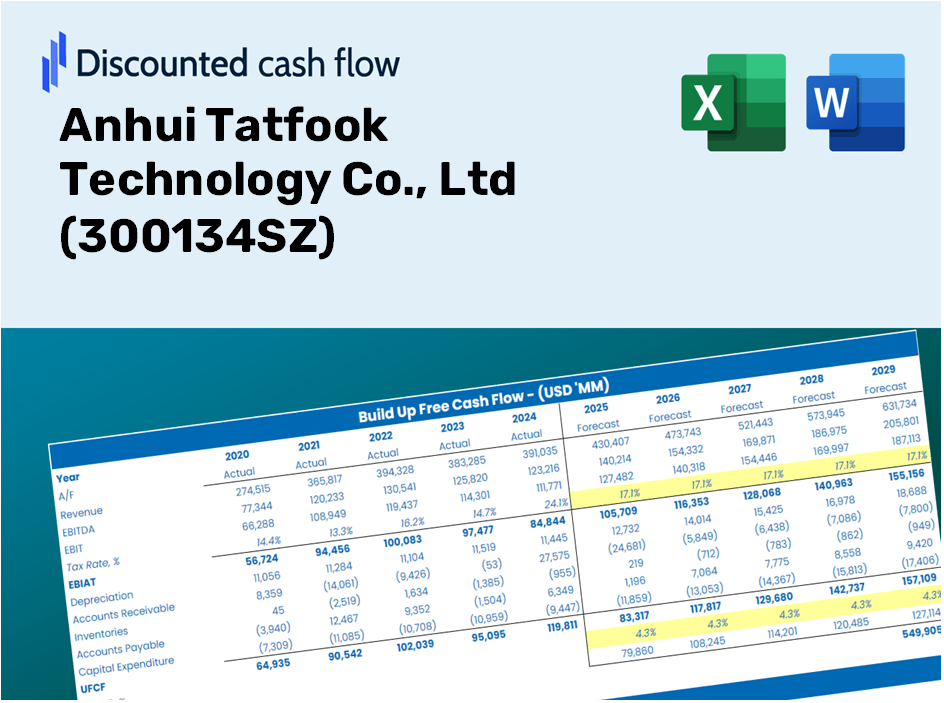
Simplify Anhui Tatfook Technology Co., Ltd (300134SZ) valuation with this customizable DCF Calculator! Featuring real Anhui Tatfook Technology Co., Ltd (300134SZ) financials and adjustable forecast inputs, you can test scenarios and uncover Anhui Tatfook Technology Co., Ltd (300134SZ) fair value in minutes.
What You Will Receive
- Customizable Excel Template: A fully adaptable Excel-based DCF Calculator featuring pre-loaded financials for Anhui Tatfook Technology Co., Ltd (300134SZ).
- Comprehensive Data: Access to historical figures and forward-looking projections (highlighted in the yellow cells).
- Adjustable Forecasts: Modify key assumptions such as revenue growth, EBITDA percentage, and WACC.
- Instant Calculations: Quickly observe how your adjustments affect the valuation of Anhui Tatfook Technology Co., Ltd (300134SZ).
- Professional Resource: Designed for investors, CFOs, consultants, and financial analysts alike.
- User-Friendly Interface: Organized for clarity and simplicity, complete with step-by-step guidance.
Key Features
- Pre-Loaded Data: Anhui Tatfook Technology Co., Ltd’s historical financial statements and pre-filled forecasts.
- Fully Adjustable Inputs: Modify WACC, tax rates, revenue growth, and EBITDA margins as needed.
- Instant Results: View the intrinsic value of Anhui Tatfook Technology Co., Ltd in real time.
- Clear Visual Outputs: Dashboard charts showcase valuation results and important metrics.
- Built for Accuracy: A professional tool designed for analysts, investors, and finance professionals.
How It Works
- Step 1: Download the Excel file.
- Step 2: Examine the pre-filled financial data and projections for Anhui Tatfook Technology Co., Ltd (300134SZ).
- Step 3: Adjust key inputs such as revenue growth, WACC, and tax rates (highlighted cells).
- Step 4: Observe the DCF model refresh in real-time as you modify the assumptions.
- Step 5: Evaluate the results and leverage them for your investment strategies.
Why Opt for This Calculator?
- Reliable Data: Access authentic financials from Anhui Tatfook Technology Co., Ltd (300134SZ) for trustworthy valuation outcomes.
- Adjustable Settings: Tailor essential parameters such as growth rates, WACC, and tax rates to reflect your forecasts.
- Efficient: Pre-configured calculations save you the hassle of starting from square one.
- Professional Quality: Crafted for investors, analysts, and consultants alike.
- User-Centric: A straightforward interface and guided instructions ensure ease of use for everyone.
Who Can Benefit from Anhui Tatfook Technology Co., Ltd (300134SZ)?
- Investors: Enhance your investment strategies with our advanced analytics tools tailored for informed decision-making.
- Financial Analysts: Streamline your workflow using our customizable financial models designed for efficiency.
- Consultants: Effortlessly modify our templates for impactful client presentations and detailed reports.
- Tech Enthusiasts: Expand your knowledge of technological innovations and market trends through practical insights.
- Educators and Students: Leverage our resources as a hands-on learning aid in technology and finance curricula.
Contents of the Template
- Preloaded 300134SZ Data: Historical and projected financial data, including revenue, EBIT, and capital expenditures.
- DCF and WACC Models: Advanced spreadsheets for determining intrinsic value and Weighted Average Cost of Capital.
- Editable Inputs: Cells highlighted in yellow for modifying revenue growth, tax rates, and discount rates.
- Financial Statements: Detailed annual and quarterly financials for in-depth analysis.
- Key Ratios: Ratios for profitability, leverage, and efficiency to assess performance.
- Dashboard and Charts: Visual representations of valuation results and underlying assumptions.
Disclaimer
All information, articles, and product details provided on this website are for general informational and educational purposes only. We do not claim any ownership over, nor do we intend to infringe upon, any trademarks, copyrights, logos, brand names, or other intellectual property mentioned or depicted on this site. Such intellectual property remains the property of its respective owners, and any references here are made solely for identification or informational purposes, without implying any affiliation, endorsement, or partnership.
We make no representations or warranties, express or implied, regarding the accuracy, completeness, or suitability of any content or products presented. Nothing on this website should be construed as legal, tax, investment, financial, medical, or other professional advice. In addition, no part of this site—including articles or product references—constitutes a solicitation, recommendation, endorsement, advertisement, or offer to buy or sell any securities, franchises, or other financial instruments, particularly in jurisdictions where such activity would be unlawful.
All content is of a general nature and may not address the specific circumstances of any individual or entity. It is not a substitute for professional advice or services. Any actions you take based on the information provided here are strictly at your own risk. You accept full responsibility for any decisions or outcomes arising from your use of this website and agree to release us from any liability in connection with your use of, or reliance upon, the content or products found herein.