
|
Huafon Microfibre Co., Ltd. (300180.SZ) DCF Valuation |
Fully Editable: Tailor To Your Needs In Excel Or Sheets
Professional Design: Trusted, Industry-Standard Templates
Investor-Approved Valuation Models
MAC/PC Compatible, Fully Unlocked
No Expertise Is Needed; Easy To Follow
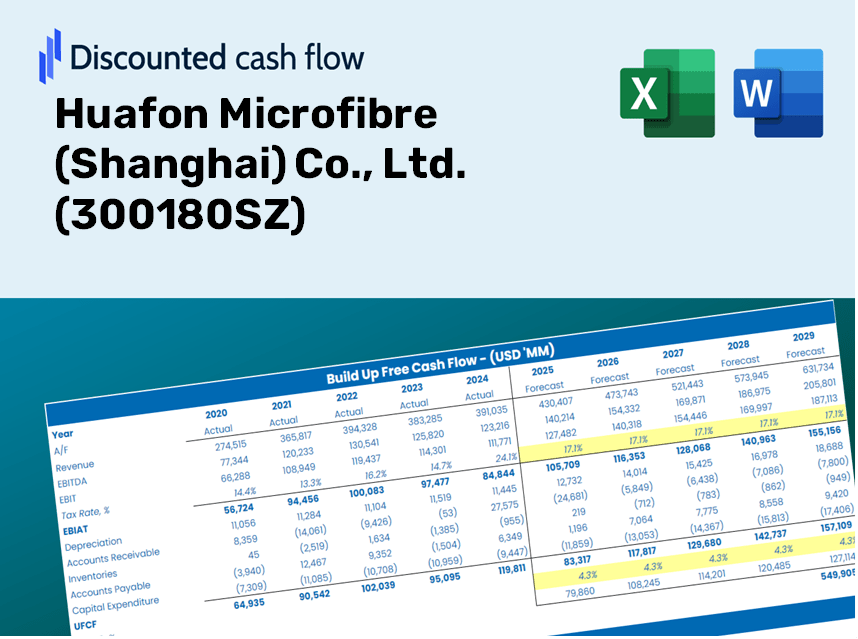
Huafon Microfibre (Shanghai) Co., Ltd. (300180.SZ) Bundle
Looking to determine the intrinsic value of Huafon Microfibre (Shanghai) Co., Ltd.? Our (300180SZ) DCF Calculator integrates real-world data with extensive customization features, enabling you to adjust forecasts and enhance your investment choices.
Discounted Cash Flow (DCF) - (USD MM)
| Year | AY1 2020 |
AY2 2021 |
AY3 2022 |
AY4 2023 |
AY5 2024 |
FY1 2025 |
FY2 2026 |
FY3 2027 |
FY4 2028 |
FY5 2029 |
|---|---|---|---|---|---|---|---|---|---|---|
| Revenue | 3,219.1 | 4,142.2 | 4,232.7 | 4,587.2 | 4,581.8 | 5,023.1 | 5,507.0 | 6,037.6 | 6,619.2 | 7,256.9 |
| Revenue Growth, % | 0 | 28.68 | 2.18 | 8.38 | -0.11964 | 9.63 | 9.63 | 9.63 | 9.63 | 9.63 |
| EBITDA | 757.3 | 657.3 | 445.8 | 319.1 | 602.7 | 703.6 | 771.4 | 845.7 | 927.2 | 1,016.5 |
| EBITDA, % | 23.53 | 15.87 | 10.53 | 6.96 | 13.15 | 14.01 | 14.01 | 14.01 | 14.01 | 14.01 |
| Depreciation | 372.5 | 418.5 | 441.6 | 460.7 | 464.8 | 525.4 | 576.0 | 631.5 | 692.3 | 759.0 |
| Depreciation, % | 11.57 | 10.1 | 10.43 | 10.04 | 10.15 | 10.46 | 10.46 | 10.46 | 10.46 | 10.46 |
| EBIT | 384.8 | 238.8 | 4.1 | -141.6 | 137.9 | 178.2 | 195.4 | 214.2 | 234.8 | 257.5 |
| EBIT, % | 11.95 | 5.76 | 0.09789935 | -3.09 | 3.01 | 3.55 | 3.55 | 3.55 | 3.55 | 3.55 |
| Total Cash | 362.4 | 494.2 | 552.9 | 439.1 | 422.8 | 553.1 | 606.3 | 664.8 | 728.8 | 799.0 |
| Total Cash, percent | .0 | .0 | .0 | .0 | .0 | .0 | .0 | .0 | .0 | .0 |
| Account Receivables | 1,036.4 | 712.4 | 772.1 | 1,049.1 | 1,041.2 | 1,137.6 | 1,247.2 | 1,367.3 | 1,499.0 | 1,643.4 |
| Account Receivables, % | 32.2 | 17.2 | 18.24 | 22.87 | 22.73 | 22.65 | 22.65 | 22.65 | 22.65 | 22.65 |
| Inventories | 526.0 | 938.0 | 988.2 | 717.5 | 836.2 | 966.7 | 1,059.8 | 1,161.9 | 1,273.8 | 1,396.6 |
| Inventories, % | 16.34 | 22.64 | 23.35 | 15.64 | 18.25 | 19.24 | 19.24 | 19.24 | 19.24 | 19.24 |
| Accounts Payable | 568.1 | 579.6 | 391.8 | 70.2 | 696.0 | 578.8 | 634.6 | 695.7 | 762.8 | 836.2 |
| Accounts Payable, % | 17.65 | 13.99 | 9.26 | 1.53 | 15.19 | 11.52 | 11.52 | 11.52 | 11.52 | 11.52 |
| Capital Expenditure | -879.5 | -579.7 | -246.6 | -105.6 | -87.8 | -516.0 | -565.7 | -620.2 | -680.0 | -745.5 |
| Capital Expenditure, % | -27.32 | -14 | -5.83 | -2.3 | -1.92 | -10.27 | -10.27 | -10.27 | -10.27 | -10.27 |
| Tax Rate, % | 1.59 | 1.59 | 1.59 | 1.59 | 1.59 | 1.59 | 1.59 | 1.59 | 1.59 | 1.59 |
| EBITAT | 411.9 | 225.1 | 3.9 | -127.2 | 135.7 | 170.1 | 186.4 | 204.4 | 224.1 | 245.7 |
| Depreciation | ||||||||||
| Changes in Account Receivables | ||||||||||
| Changes in Inventories | ||||||||||
| Changes in Accounts Payable | ||||||||||
| Capital Expenditure | ||||||||||
| UFCF | -1,089.5 | -12.5 | -98.8 | -99.9 | 1,027.7 | -164.6 | 49.8 | 54.6 | 59.8 | 65.6 |
| WACC, % | 5.92 | 5.9 | 5.9 | 5.88 | 5.91 | 5.9 | 5.9 | 5.9 | 5.9 | 5.9 |
| PV UFCF | ||||||||||
| SUM PV UFCF | 31.7 | |||||||||
| Long Term Growth Rate, % | 4.00 | |||||||||
| Free cash flow (T + 1) | 68 | |||||||||
| Terminal Value | 3,588 | |||||||||
| Present Terminal Value | 2,693 | |||||||||
| Enterprise Value | 2,725 | |||||||||
| Net Debt | 259 | |||||||||
| Equity Value | 2,466 | |||||||||
| Diluted Shares Outstanding, MM | 1,762 | |||||||||
| Equity Value Per Share | 1.40 |
Benefits You Will Receive
- Customizable Excel Template: A fully editable DCF Calculator in Excel, complete with pre-populated financial data for Huafon Microfibre (300180SZ).
- Comprehensive Data: Access to historical financial data and future projections (highlighted in the yellow cells).
- Adjustable Forecasting: Modify key assumptions such as revenue growth rates, EBITDA percentages, and WACC.
- Instant Calculations: Get immediate feedback on how your inputs affect Huafon Microfibre’s valuation.
- Professional Resource: Designed for investors, CFOs, consultants, and financial analysts.
- Easy-to-Navigate Layout: Organized for user-friendliness, with clear instructions for each step.
Key Features
- Comprehensive Data Set: Huafon Microfibre's historical financial reports and pre-populated forecasts.
- Customizable Parameters: Adjust WACC, tax rates, revenue growth, and EBITDA margins to your specifications.
- Real-Time Calculations: Monitor Huafon Microfibre's intrinsic value updates as you make changes.
- Intuitive Visualization: Dashboard charts present valuation results and essential metrics clearly.
- Designed for Precision: An expert tool tailored for analysts, investors, and finance professionals.
How It Functions
- Download the Template: Gain immediate access to the Excel-based Huafon Microfibre (Shanghai) Co., Ltd. (300180SZ) DCF Calculator.
- Input Your Assumptions: Modify the yellow-highlighted cells for growth rates, WACC, profit margins, and other parameters.
- Instant Calculations: The model automatically recalculates the intrinsic value of Huafon Microfibre.
- Test Scenarios: Experiment with different assumptions to assess potential changes in valuation.
- Analyze and Decide: Leverage the results to inform your investment or financial decisions.
Why Choose Huafon Microfibre's Financial Calculator?
- All-in-One Solution: Combines DCF, WACC, and financial ratio analyses for comprehensive evaluation.
- Tailor-Made Inputs: Modify the highlighted cells to explore different financial scenarios.
- In-Depth Analysis: Automatically computes the intrinsic value and Net Present Value for Huafon Microfibre (300180SZ).
- Loaded with Data: Historical and projected information provides reliable starting points for analysis.
- Premium Quality: Perfect for financial analysts, investors, and business advisors seeking precision.
Who Can Benefit from This Product?
- Investors: Effectively assess the fair value of Huafon Microfibre (Shanghai) Co., Ltd. (300180SZ) prior to making investment choices.
- CFOs: Utilize a high-quality DCF model for precise financial reporting and analysis.
- Consultants: Easily customize the template for client valuation reports.
- Entrepreneurs: Acquire knowledge of financial modeling practices employed by leading companies.
- Educators: Employ it as a resource for teaching valuation techniques.
Contents of the Huafon Microfibre Template
- Preloaded Huafon Data: Historical and projected financial figures, including revenue, EBIT, and capital expenditures.
- DCF and WACC Models: Advanced spreadsheets for determining intrinsic value and Weighted Average Cost of Capital.
- Editable Inputs: Yellow-highlighted cells designed for modifying revenue growth, tax rates, and discount rates.
- Financial Statements: Detailed annual and quarterly financial reports for in-depth analysis.
- Key Ratios: Metrics for profitability, leverage, and efficiency to assess performance.
- Dashboard and Charts: Visual representations of valuation results and underlying assumptions.
Disclaimer
All information, articles, and product details provided on this website are for general informational and educational purposes only. We do not claim any ownership over, nor do we intend to infringe upon, any trademarks, copyrights, logos, brand names, or other intellectual property mentioned or depicted on this site. Such intellectual property remains the property of its respective owners, and any references here are made solely for identification or informational purposes, without implying any affiliation, endorsement, or partnership.
We make no representations or warranties, express or implied, regarding the accuracy, completeness, or suitability of any content or products presented. Nothing on this website should be construed as legal, tax, investment, financial, medical, or other professional advice. In addition, no part of this site—including articles or product references—constitutes a solicitation, recommendation, endorsement, advertisement, or offer to buy or sell any securities, franchises, or other financial instruments, particularly in jurisdictions where such activity would be unlawful.
All content is of a general nature and may not address the specific circumstances of any individual or entity. It is not a substitute for professional advice or services. Any actions you take based on the information provided here are strictly at your own risk. You accept full responsibility for any decisions or outcomes arising from your use of this website and agree to release us from any liability in connection with your use of, or reliance upon, the content or products found herein.