
|
Beijing E-Hualu Information Technology Co., Ltd. (300212.SZ) DCF Valuation |
Fully Editable: Tailor To Your Needs In Excel Or Sheets
Professional Design: Trusted, Industry-Standard Templates
Investor-Approved Valuation Models
MAC/PC Compatible, Fully Unlocked
No Expertise Is Needed; Easy To Follow
Beijing E-Hualu Information Technology Co., Ltd. (300212.SZ) Bundle
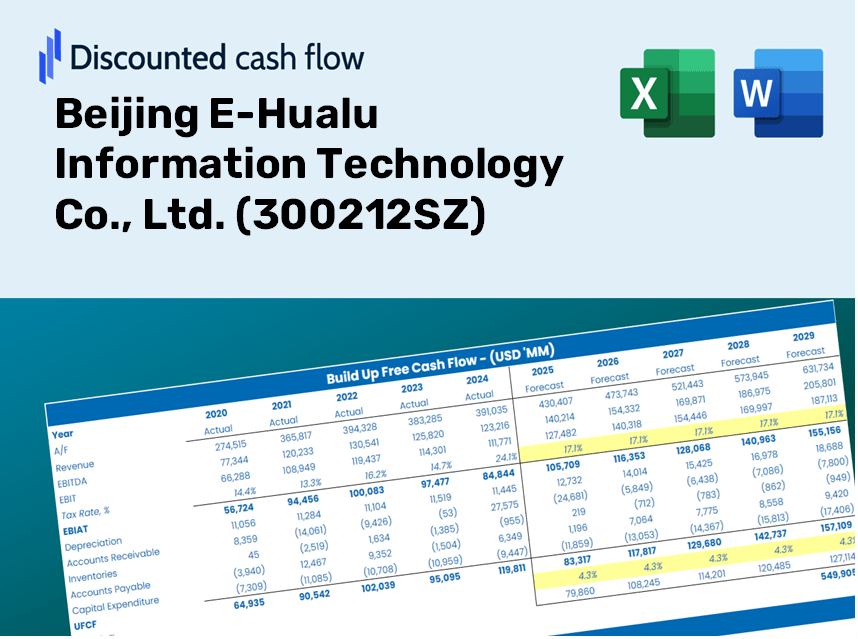
Simplify Beijing E-Hualu Information Technology Co., Ltd. (300212SZ) valuation with this customizable DCF Calculator! Featuring real Beijing E-Hualu Information Technology Co., Ltd. (300212SZ) financials and adjustable forecast inputs, you can test scenarios and uncover Beijing E-Hualu Information Technology Co., Ltd. (300212SZ) fair value in minutes.
Discounted Cash Flow (DCF) - (USD MM)
| Year | AY1 2020 |
AY2 2021 |
AY3 2022 |
AY4 2023 |
AY5 2024 |
FY1 2025 |
FY2 2026 |
FY3 2027 |
FY4 2028 |
FY5 2029 |
|---|---|---|---|---|---|---|---|---|---|---|
| Revenue | 2,587.0 | 2,020.1 | 1,603.9 | 765.0 | 464.8 | 309.0 | 205.4 | 136.6 | 90.8 | 60.4 |
| Revenue Growth, % | 0 | -21.91 | -20.6 | -52.31 | -39.24 | -33.52 | -33.52 | -33.52 | -33.52 | -33.52 |
| EBITDA | 663.5 | 190.8 | 254.0 | -1,207.0 | -1,505.9 | -92.1 | -61.3 | -40.7 | -27.1 | -18.0 |
| EBITDA, % | 25.65 | 9.44 | 15.84 | -157.79 | -323.98 | -29.81 | -29.81 | -29.81 | -29.81 | -29.81 |
| Depreciation | 129.7 | 136.5 | 138.9 | 171.7 | 91.8 | 38.7 | 25.7 | 17.1 | 11.4 | 7.6 |
| Depreciation, % | 5.01 | 6.76 | 8.66 | 22.45 | 19.76 | 12.53 | 12.53 | 12.53 | 12.53 | 12.53 |
| EBIT | 533.9 | 54.3 | 115.1 | -1,378.8 | -1,597.7 | -104.8 | -69.6 | -46.3 | -30.8 | -20.5 |
| EBIT, % | 20.64 | 2.69 | 7.17 | -180.24 | -343.74 | -33.9 | -33.9 | -33.9 | -33.9 | -33.9 |
| Total Cash | 1,115.1 | 306.6 | 551.8 | 967.9 | 888.2 | 180.9 | 120.3 | 80.0 | 53.2 | 35.3 |
| Total Cash, percent | .0 | .0 | .0 | .0 | .0 | .0 | .0 | .0 | .0 | .0 |
| Account Receivables | 8,702.5 | 7,837.8 | 7,300.6 | 5,992.8 | 4,164.8 | 309.0 | 205.4 | 136.6 | 90.8 | 60.4 |
| Account Receivables, % | 336.39 | 387.99 | 455.16 | 783.4 | 896.06 | 100 | 100 | 100 | 100 | 100 |
| Inventories | 312.3 | 428.4 | 385.5 | 385.5 | 375.1 | 116.4 | 77.4 | 51.5 | 34.2 | 22.8 |
| Inventories, % | 12.07 | 21.21 | 24.03 | 50.4 | 80.7 | 37.68 | 37.68 | 37.68 | 37.68 | 37.68 |
| Accounts Payable | 3,955.1 | 3,096.2 | 2,637.6 | 1,853.8 | 1,949.2 | 309.0 | 205.4 | 136.6 | 90.8 | 60.4 |
| Accounts Payable, % | 152.88 | 153.27 | 164.45 | 242.33 | 419.37 | 100 | 100 | 100 | 100 | 100 |
| Capital Expenditure | -313.2 | -485.4 | -266.8 | -296.6 | -206.3 | -84.0 | -55.8 | -37.1 | -24.7 | -16.4 |
| Capital Expenditure, % | -12.11 | -24.03 | -16.63 | -38.77 | -44.38 | -27.18 | -27.18 | -27.18 | -27.18 | -27.18 |
| Tax Rate, % | -0.53711 | -0.53711 | -0.53711 | -0.53711 | -0.53711 | -0.53711 | -0.53711 | -0.53711 | -0.53711 | -0.53711 |
| EBITAT | 450.2 | 59.8 | 30.4 | -1,390.6 | -1,606.3 | -86.1 | -57.2 | -38.0 | -25.3 | -16.8 |
| Depreciation | ||||||||||
| Changes in Account Receivables | ||||||||||
| Changes in Inventories | ||||||||||
| Changes in Accounts Payable | ||||||||||
| Capital Expenditure | ||||||||||
| UFCF | -4,793.0 | -399.4 | 24.1 | -991.5 | 213.1 | 2,342.9 | -48.3 | -32.1 | -21.3 | -14.2 |
| WACC, % | 8.86 | 9.07 | 8.11 | 9.07 | 9.07 | 8.84 | 8.84 | 8.84 | 8.84 | 8.84 |
| PV UFCF | ||||||||||
| SUM PV UFCF | 2,062.5 | |||||||||
| Long Term Growth Rate, % | 2.00 | |||||||||
| Free cash flow (T + 1) | -14 | |||||||||
| Terminal Value | -212 | |||||||||
| Present Terminal Value | -139 | |||||||||
| Enterprise Value | 1,924 | |||||||||
| Net Debt | 4,777 | |||||||||
| Equity Value | -2,854 | |||||||||
| Diluted Shares Outstanding, MM | 722 | |||||||||
| Equity Value Per Share | -3.95 |
What You Will Gain
- Authentic E-Hualu Data: Comprehensive financials – encompassing revenue to EBIT – grounded in actual and projected figures.
- Complete Customization: Modify essential parameters (highlighted cells) such as WACC, growth %, and tax rates.
- Immediate Valuation Updates: Automatic recalibrations to evaluate how changes affect the fair value of E-Hualu (300212SZ).
- Flexible Excel Template: Designed for effortless modifications, scenario analysis, and in-depth forecasting.
- Efficient and Precise: Eliminate the need to create models from the ground up while ensuring accuracy and adaptability.
Key Features
- Comprehensive [300212SZ] Data: Equipped with Beijing E-Hualu's historical financial performance and future projections.
- Customizable Financial Inputs: Modify revenue growth rates, profit margins, discount rates, tax assumptions, and capital investment plans.
- Interactive Valuation Tool: Automatically refreshes Net Present Value (NPV) and intrinsic value based on your custom inputs.
- Multiple Scenario Analysis: Develop various forecasting scenarios to explore different valuation possibilities.
- Intuitive User Interface: A clean, organized design suitable for both industry veterans and newcomers.
How It Functions
- Download: Obtain the pre-configured Excel file containing financial data for Beijing E-Hualu Information Technology Co., Ltd. (300212SZ).
- Customize: Modify forecasts such as revenue growth, EBITDA percentage, and WACC.
- Update Automatically: Watch as intrinsic value and NPV calculations refresh in real-time.
- Test Scenarios: Develop various projections and instantly compare the results.
- Make Decisions: Leverage the valuation findings to inform your investment strategy.
Why Opt for Our Calculator?
- Time Efficiency: Skip the hassle of building a DCF model from the ground up – it's ready for immediate use.
- Enhanced Accuracy: Dependable financial data and formulas minimize valuation errors.
- Completely Customizable: Adjust the model to align with your specific assumptions and forecasts.
- User-Friendly: Intuitive charts and outputs simplify result analysis.
- Endorsed by Professionals: Crafted for experts who prioritize accuracy and ease of use.
Who Can Benefit from This Product?
- Individual Investors: Make well-informed choices regarding the purchase or sale of Beijing E-Hualu Information Technology Co., Ltd. (300212SZ) stock.
- Financial Analysts: Enhance valuation workflows with comprehensive financial models at your fingertips.
- Consultants: Provide clients with precise and timely valuation insights for informed decision-making.
- Business Owners: Gain insights into how major companies like Beijing E-Hualu Information Technology Co., Ltd. (300212SZ) are valued to shape your business strategy.
- Finance Students: Master valuation methodologies through the exploration of real-world data and examples.
Contents of the Template
- Pre-Filled Data: Contains historical financial data and projections for Beijing E-Hualu Information Technology Co., Ltd. (300212SZ).
- Discounted Cash Flow Model: An editable DCF valuation model featuring automatic calculations.
- Weighted Average Cost of Capital (WACC): A specialized sheet for computing WACC with customizable inputs.
- Key Financial Ratios: Evaluate the profitability, efficiency, and leverage of Beijing E-Hualu Information Technology Co., Ltd. (300212SZ).
- Customizable Inputs: Easily modify revenue growth, profit margins, and tax rates.
- Clear Dashboard: Visual representations including charts and tables that summarize essential valuation outcomes.
Disclaimer
All information, articles, and product details provided on this website are for general informational and educational purposes only. We do not claim any ownership over, nor do we intend to infringe upon, any trademarks, copyrights, logos, brand names, or other intellectual property mentioned or depicted on this site. Such intellectual property remains the property of its respective owners, and any references here are made solely for identification or informational purposes, without implying any affiliation, endorsement, or partnership.
We make no representations or warranties, express or implied, regarding the accuracy, completeness, or suitability of any content or products presented. Nothing on this website should be construed as legal, tax, investment, financial, medical, or other professional advice. In addition, no part of this site—including articles or product references—constitutes a solicitation, recommendation, endorsement, advertisement, or offer to buy or sell any securities, franchises, or other financial instruments, particularly in jurisdictions where such activity would be unlawful.
All content is of a general nature and may not address the specific circumstances of any individual or entity. It is not a substitute for professional advice or services. Any actions you take based on the information provided here are strictly at your own risk. You accept full responsibility for any decisions or outcomes arising from your use of this website and agree to release us from any liability in connection with your use of, or reliance upon, the content or products found herein.