
|
Unilumin Group Co., Ltd (300232.SZ) DCF Valuation |
Fully Editable: Tailor To Your Needs In Excel Or Sheets
Professional Design: Trusted, Industry-Standard Templates
Investor-Approved Valuation Models
MAC/PC Compatible, Fully Unlocked
No Expertise Is Needed; Easy To Follow
Unilumin Group Co., Ltd (300232.SZ) Bundle
Looking to determine the intrinsic value of Unilumin Group Co., Ltd? Our (300232SZ) DCF Calculator integrates real-world data with extensive customization options, enabling you to adjust forecasts and make more informed investment choices.
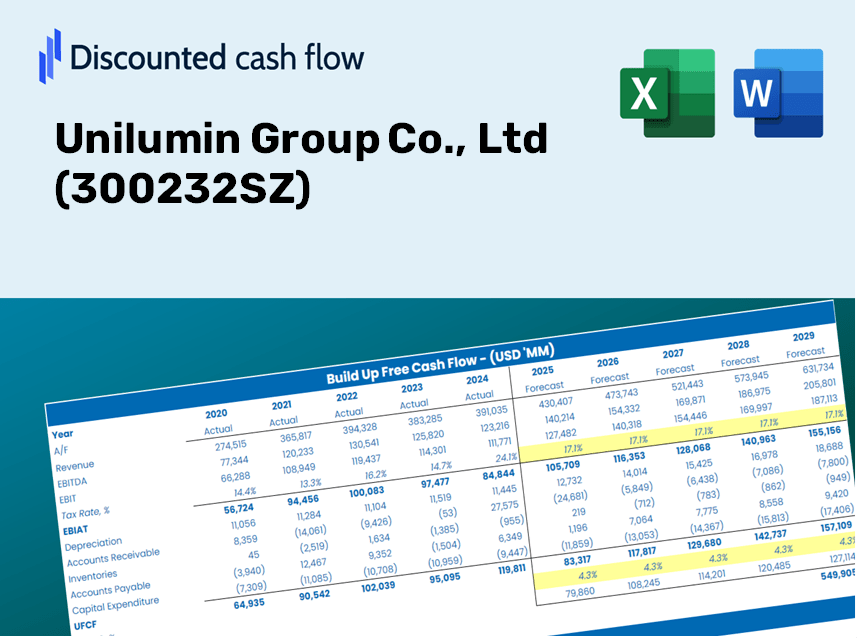
Discounted Cash Flow (DCF) - (USD MM)
| Year | AY1 2020 |
AY2 2021 |
AY3 2022 |
AY4 2023 |
AY5 2024 |
FY1 2025 |
FY2 2026 |
FY3 2027 |
FY4 2028 |
FY5 2029 |
|---|---|---|---|---|---|---|---|---|---|---|
| Revenue | 4,961.8 | 7,229.1 | 7,075.9 | 7,410.3 | 7,773.6 | 8,807.6 | 9,979.2 | 11,306.5 | 12,810.4 | 14,514.3 |
| Revenue Growth, % | 0 | 45.69 | -2.12 | 4.73 | 4.9 | 13.3 | 13.3 | 13.3 | 13.3 | 13.3 |
| EBITDA | 367.4 | 333.3 | 216.4 | 323.9 | 453.9 | 445.4 | 504.6 | 571.7 | 647.8 | 733.9 |
| EBITDA, % | 7.4 | 4.61 | 3.06 | 4.37 | 5.84 | 5.06 | 5.06 | 5.06 | 5.06 | 5.06 |
| Depreciation | 168.7 | 157.1 | 176.9 | 199.2 | 222.5 | 240.0 | 271.9 | 308.1 | 349.0 | 395.5 |
| Depreciation, % | 3.4 | 2.17 | 2.5 | 2.69 | 2.86 | 2.72 | 2.72 | 2.72 | 2.72 | 2.72 |
| EBIT | 198.6 | 176.2 | 39.6 | 124.7 | 231.5 | 205.4 | 232.7 | 263.7 | 298.7 | 338.5 |
| EBIT, % | 4 | 2.44 | 0.55916 | 1.68 | 2.98 | 2.33 | 2.33 | 2.33 | 2.33 | 2.33 |
| Total Cash | 1,310.5 | 1,634.1 | 1,808.2 | 2,246.3 | 1,829.1 | 2,262.0 | 2,562.9 | 2,903.8 | 3,290.1 | 3,727.7 |
| Total Cash, percent | .0 | .0 | .0 | .0 | .0 | .0 | .0 | .0 | .0 | .0 |
| Account Receivables | 2,226.1 | 2,739.5 | 2,492.9 | 2,737.1 | 2,608.0 | 3,320.0 | 3,761.7 | 4,262.0 | 4,828.9 | 5,471.2 |
| Account Receivables, % | 44.86 | 37.9 | 35.23 | 36.94 | 33.55 | 37.7 | 37.7 | 37.7 | 37.7 | 37.7 |
| Inventories | 1,398.1 | 2,487.8 | 1,876.4 | 1,574.4 | 1,807.8 | 2,353.6 | 2,666.7 | 3,021.3 | 3,423.2 | 3,878.6 |
| Inventories, % | 28.18 | 34.41 | 26.52 | 21.25 | 23.26 | 26.72 | 26.72 | 26.72 | 26.72 | 26.72 |
| Accounts Payable | 2,725.3 | 4,036.9 | 3,108.6 | 3,411.3 | 3,927.4 | 4,425.9 | 5,014.7 | 5,681.7 | 6,437.4 | 7,293.6 |
| Accounts Payable, % | 54.93 | 55.84 | 43.93 | 46.03 | 50.52 | 50.25 | 50.25 | 50.25 | 50.25 | 50.25 |
| Capital Expenditure | -479.4 | -473.6 | -264.4 | -361.6 | -620.3 | -577.9 | -654.8 | -741.9 | -840.6 | -952.4 |
| Capital Expenditure, % | -9.66 | -6.55 | -3.74 | -4.88 | -7.98 | -6.56 | -6.56 | -6.56 | -6.56 | -6.56 |
| Tax Rate, % | 25.15 | 25.15 | 25.15 | 25.15 | 25.15 | 25.15 | 25.15 | 25.15 | 25.15 | 25.15 |
| EBITAT | 184.6 | 149.1 | 39.6 | 102.2 | 173.3 | 178.4 | 202.2 | 229.1 | 259.5 | 294.1 |
| Depreciation | ||||||||||
| Changes in Account Receivables | ||||||||||
| Changes in Inventories | ||||||||||
| Changes in Accounts Payable | ||||||||||
| Capital Expenditure | ||||||||||
| UFCF | -1,024.9 | -458.9 | -118.3 | 300.3 | 187.3 | -918.8 | -346.7 | -392.8 | -445.0 | -504.2 |
| WACC, % | 8.71 | 8.69 | 8.73 | 8.68 | 8.66 | 8.69 | 8.69 | 8.69 | 8.69 | 8.69 |
| PV UFCF | ||||||||||
| SUM PV UFCF | -2,095.9 | |||||||||
| Long Term Growth Rate, % | 4.00 | |||||||||
| Free cash flow (T + 1) | -524 | |||||||||
| Terminal Value | -11,173 | |||||||||
| Present Terminal Value | -7,365 | |||||||||
| Enterprise Value | -9,461 | |||||||||
| Net Debt | -1,043 | |||||||||
| Equity Value | -8,418 | |||||||||
| Diluted Shares Outstanding, MM | 1,110 | |||||||||
| Equity Value Per Share | -7.58 |
What You Will Receive
- Comprehensive 300232 Financials: Access to historical and projected data for precise valuation.
- Customizable Parameters: Adjust WACC, tax rates, revenue growth, and capital expenditures as needed.
- Real-Time Calculations: Dynamic calculations for intrinsic value and NPV.
- Scenario Analysis: Explore a variety of scenarios to assess Unilumin's future prospects.
- User-Friendly Design: Designed for professionals while remaining easy for newcomers to navigate.
Key Features
- 🔍 Real-Life Unilumin Financials: Pre-filled historical and projected data for Unilumin Group Co., Ltd (300232SZ).
- ✏️ Fully Customizable Inputs: Modify all essential parameters (yellow cells) such as WACC, growth %, and tax rates.
- 📊 Professional DCF Valuation: Integrated formulas compute Unilumin’s intrinsic value using the Discounted Cash Flow method.
- ⚡ Instant Results: Access Unilumin’s valuation immediately after making adjustments.
- Scenario Analysis: Evaluate and compare outcomes for different financial assumptions side-by-side.
How It Works
- Step 1: Download the Excel file.
- Step 2: Examine Unilumin Group Co., Ltd's (300232SZ) pre-filled financial data and projections.
- Step 3: Adjust key inputs such as revenue growth, WACC, and tax rates (highlighted cells).
- Step 4: Observe the DCF model refresh in real-time as you make changes to the assumptions.
- Step 5: Evaluate the results and utilize the findings for informed investment strategies.
Why Opt for This Calculator?
- Designed for Experts: A sophisticated tool tailored for analysts, CFOs, and consultants.
- Accurate Data: Unilumin Group Co., Ltd’s (300232SZ) historical and projected financials are preloaded for precision.
- Scenario Analysis: Effortlessly test various forecasts and assumptions.
- Transparent Outputs: Automatically computes intrinsic value, NPV, and other essential metrics.
- User-Friendly: Comprehensive step-by-step instructions to facilitate your experience.
Who Can Benefit from This Product?
- Investors: Assess the valuation of Unilumin Group Co., Ltd (300232SZ) before making buying or selling decisions.
- CFOs and Financial Analysts: Optimize valuation methods and validate their projections.
- Startup Founders: Gain insights into how large public companies, like Unilumin Group Co., Ltd (300232SZ), are appraised.
- Consultants: Provide comprehensive valuation reports for your clients.
- Students and Educators: Utilize live data to practice and teach valuation strategies.
Contents of the Template
- Pre-Filled DCF Model: Unilumin Group Co., Ltd's financial data preloaded for immediate use.
- WACC Calculator: Comprehensive calculations for Weighted Average Cost of Capital.
- Financial Ratios: Assess Unilumin's profitability, leverage, and efficiency.
- Editable Inputs: Modify assumptions like growth rates, margins, and CAPEX to suit your scenarios.
- Financial Statements: Access annual and quarterly reports to facilitate detailed analysis.
- Interactive Dashboard: Visually analyze key valuation metrics and results with ease.
Disclaimer
All information, articles, and product details provided on this website are for general informational and educational purposes only. We do not claim any ownership over, nor do we intend to infringe upon, any trademarks, copyrights, logos, brand names, or other intellectual property mentioned or depicted on this site. Such intellectual property remains the property of its respective owners, and any references here are made solely for identification or informational purposes, without implying any affiliation, endorsement, or partnership.
We make no representations or warranties, express or implied, regarding the accuracy, completeness, or suitability of any content or products presented. Nothing on this website should be construed as legal, tax, investment, financial, medical, or other professional advice. In addition, no part of this site—including articles or product references—constitutes a solicitation, recommendation, endorsement, advertisement, or offer to buy or sell any securities, franchises, or other financial instruments, particularly in jurisdictions where such activity would be unlawful.
All content is of a general nature and may not address the specific circumstances of any individual or entity. It is not a substitute for professional advice or services. Any actions you take based on the information provided here are strictly at your own risk. You accept full responsibility for any decisions or outcomes arising from your use of this website and agree to release us from any liability in connection with your use of, or reliance upon, the content or products found herein.