
|
Hunan Er-Kang Pharmaceutical Co., Ltd (300267.SZ) DCF Valuation |
Fully Editable: Tailor To Your Needs In Excel Or Sheets
Professional Design: Trusted, Industry-Standard Templates
Investor-Approved Valuation Models
MAC/PC Compatible, Fully Unlocked
No Expertise Is Needed; Easy To Follow
Hunan Er-Kang Pharmaceutical Co., Ltd (300267.SZ) Bundle
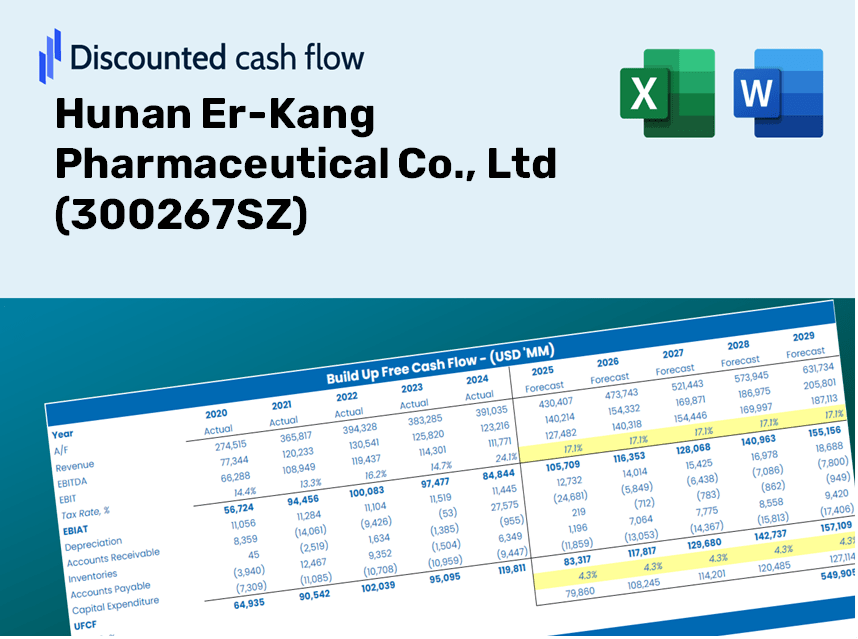
Simplify Hunan Er-Kang Pharmaceutical Co., Ltd (300267SZ) valuation with this customizable DCF Calculator! Featuring real Hunan Er-Kang financials and adjustable forecast inputs, you can test scenarios and uncover Hunan Er-Kang fair value in minutes.
Discounted Cash Flow (DCF) - (USD MM)
| Year | AY1 2020 |
AY2 2021 |
AY3 2022 |
AY4 2023 |
AY5 2024 |
FY1 2025 |
FY2 2026 |
FY3 2027 |
FY4 2028 |
FY5 2029 |
|---|---|---|---|---|---|---|---|---|---|---|
| Revenue | 2,382.3 | 2,235.3 | 1,870.5 | 1,783.1 | 1,139.6 | 959.4 | 807.7 | 680.0 | 572.5 | 481.9 |
| Revenue Growth, % | 0 | -6.17 | -16.32 | -4.67 | -36.09 | -15.81 | -15.81 | -15.81 | -15.81 | -15.81 |
| EBITDA | 411.0 | -625.8 | 213.5 | 12.0 | -182.1 | -28.1 | -23.6 | -19.9 | -16.8 | -14.1 |
| EBITDA, % | 17.25 | -28 | 11.42 | 0.67424 | -15.98 | -2.93 | -2.93 | -2.93 | -2.93 | -2.93 |
| Depreciation | 192.3 | 199.4 | 181.8 | 204.3 | 197.6 | 106.5 | 89.7 | 75.5 | 63.5 | 53.5 |
| Depreciation, % | 8.07 | 8.92 | 9.72 | 11.46 | 17.34 | 11.1 | 11.1 | 11.1 | 11.1 | 11.1 |
| EBIT | 218.7 | -825.1 | 31.8 | -192.3 | -379.7 | -134.6 | -113.3 | -95.4 | -80.3 | -67.6 |
| EBIT, % | 9.18 | -36.91 | 1.7 | -10.78 | -33.32 | -14.03 | -14.03 | -14.03 | -14.03 | -14.03 |
| Total Cash | 888.1 | 761.6 | 878.8 | 744.5 | 818.5 | 445.0 | 374.6 | 315.4 | 265.5 | 223.5 |
| Total Cash, percent | .0 | .0 | .0 | .0 | .0 | .0 | .0 | .0 | .0 | .0 |
| Account Receivables | 500.0 | 287.9 | 204.5 | 196.0 | 202.8 | 141.2 | 118.9 | 100.1 | 84.2 | 70.9 |
| Account Receivables, % | 20.99 | 12.88 | 10.93 | 10.99 | 17.79 | 14.72 | 14.72 | 14.72 | 14.72 | 14.72 |
| Inventories | 756.1 | 714.8 | 821.3 | 691.6 | 600.8 | 382.1 | 321.7 | 270.8 | 228.0 | 191.9 |
| Inventories, % | 31.74 | 31.98 | 43.91 | 38.79 | 52.72 | 39.83 | 39.83 | 39.83 | 39.83 | 39.83 |
| Accounts Payable | 152.2 | 137.9 | 198.7 | 122.3 | 114.7 | 76.9 | 64.8 | 54.5 | 45.9 | 38.7 |
| Accounts Payable, % | 6.39 | 6.17 | 10.62 | 6.86 | 10.06 | 8.02 | 8.02 | 8.02 | 8.02 | 8.02 |
| Capital Expenditure | -605.9 | -349.3 | -173.5 | -238.2 | -195.6 | -155.2 | -130.6 | -110.0 | -92.6 | -77.9 |
| Capital Expenditure, % | -25.43 | -15.63 | -9.27 | -13.36 | -17.16 | -16.17 | -16.17 | -16.17 | -16.17 | -16.17 |
| Tax Rate, % | 3.8 | 3.8 | 3.8 | 3.8 | 3.8 | 3.8 | 3.8 | 3.8 | 3.8 | 3.8 |
| EBITAT | 198.7 | -771.9 | 84.1 | -188.8 | -365.3 | -128.9 | -108.5 | -91.3 | -76.9 | -64.7 |
| Depreciation | ||||||||||
| Changes in Account Receivables | ||||||||||
| Changes in Inventories | ||||||||||
| Changes in Accounts Payable | ||||||||||
| Capital Expenditure | ||||||||||
| UFCF | -1,318.7 | -682.9 | 130.1 | -160.8 | -286.9 | 65.0 | -78.9 | -66.4 | -55.9 | -47.1 |
| WACC, % | 4.45 | 4.46 | 4.47 | 4.47 | 4.46 | 4.46 | 4.46 | 4.46 | 4.46 | 4.46 |
| PV UFCF | ||||||||||
| SUM PV UFCF | -153.0 | |||||||||
| Long Term Growth Rate, % | 4.00 | |||||||||
| Free cash flow (T + 1) | -49 | |||||||||
| Terminal Value | -10,624 | |||||||||
| Present Terminal Value | -8,541 | |||||||||
| Enterprise Value | -8,694 | |||||||||
| Net Debt | -193 | |||||||||
| Equity Value | -8,501 | |||||||||
| Diluted Shares Outstanding, MM | 2,063 | |||||||||
| Equity Value Per Share | -4.12 |
Benefits of Choosing Hunan Er-Kang Pharmaceutical Co., Ltd (300267SZ)
- Customizable Forecast Inputs: Flexibly adjust key assumptions (growth %, margins, WACC) to explore various scenarios.
- Relevant Industry Data: Pre-loaded financial information for Hunan Er-Kang to accelerate your assessment.
- Automated DCF Calculations: The template instantly computes Net Present Value (NPV) and intrinsic value for you.
- Professional and Adaptable: A sleek Excel model tailored to fit your valuation requirements.
- Designed for Analysts and Investors: Perfect for evaluating forecasts, confirming strategies, and optimizing your time.
Key Features
- 🔍 Real-Life (300267SZ) Financials: Pre-filled historical and projected data for Hunan Er-Kang Pharmaceutical Co., Ltd.
- ✏️ Fully Customizable Inputs: Modify all essential parameters (yellow cells) such as WACC, growth %, and tax rates.
- 📊 Professional DCF Valuation: Integrated formulas compute the intrinsic value of Hunan Er-Kang using the Discounted Cash Flow method.
- ⚡ Instant Results: Immediately visualize the valuation of Hunan Er-Kang after adjustments.
- Scenario Analysis: Evaluate and compare different outcomes based on varying financial assumptions side-by-side.
How It Functions
- Step 1: Download the ready-to-use Excel template featuring Hunan Er-Kang Pharmaceutical Co., Ltd's (300267SZ) data.
- Step 2: Navigate through the pre-filled sheets to grasp the essential metrics.
- Step 3: Adjust forecasts and assumptions within the editable yellow cells (WACC, growth rates, margins).
- Step 4: Instantly see updated results, including Hunan Er-Kang Pharmaceutical Co., Ltd's (300267SZ) intrinsic value.
- Step 5: Make well-informed investment choices or create reports based on the results.
Why Opt for This Calculator?
- User-Friendly and Accessible: Crafted for both novices and seasoned users.
- Customizable Inputs: Effortlessly adjust parameters to suit your analysis.
- Real-Time Updates: Witness immediate changes in Hunan Er-Kang Pharmaceutical's valuation as you tweak inputs.
- Pre-Configured: Comes loaded with Hunan Er-Kang's actual financial information for swift evaluations.
- Relied Upon by Experts: Utilized by investors and analysts to make sound decisions regarding (300267SZ).
Who Can Benefit from Hunan Er-Kang Pharmaceutical Co., Ltd (300267SZ)?
- Investors: Make informed decisions with our reliable pharmaceutical insights.
- Financial Analysts: Streamline your analysis with readily available data on our operations and market performance.
- Consultants: Easily customize reports and presentations for your clients using our comprehensive data.
- Pharmaceutical Enthusiasts: Expand your knowledge of the industry through our detailed case studies and metrics.
- Educators and Students: Utilize our resources as a valuable educational tool in pharmaceutical and finance curricula.
Components of the Template
- Pre-Filled Data: Features Hunan Er-Kang Pharmaceutical Co., Ltd's historical financial performance and forecasts.
- Discounted Cash Flow Model: An editable DCF valuation model with automatic calculation capabilities.
- Weighted Average Cost of Capital (WACC): A separate sheet dedicated to calculating WACC based on user-defined inputs.
- Key Financial Ratios: Assess Hunan Er-Kang’s profitability, efficiency, and financial leverage.
- Customizable Inputs: Easily adjust revenue growth rates, profit margins, and tax percentages.
- Clear Dashboard: Visual representations and tables summarizing essential valuation outcomes.
Disclaimer
All information, articles, and product details provided on this website are for general informational and educational purposes only. We do not claim any ownership over, nor do we intend to infringe upon, any trademarks, copyrights, logos, brand names, or other intellectual property mentioned or depicted on this site. Such intellectual property remains the property of its respective owners, and any references here are made solely for identification or informational purposes, without implying any affiliation, endorsement, or partnership.
We make no representations or warranties, express or implied, regarding the accuracy, completeness, or suitability of any content or products presented. Nothing on this website should be construed as legal, tax, investment, financial, medical, or other professional advice. In addition, no part of this site—including articles or product references—constitutes a solicitation, recommendation, endorsement, advertisement, or offer to buy or sell any securities, franchises, or other financial instruments, particularly in jurisdictions where such activity would be unlawful.
All content is of a general nature and may not address the specific circumstances of any individual or entity. It is not a substitute for professional advice or services. Any actions you take based on the information provided here are strictly at your own risk. You accept full responsibility for any decisions or outcomes arising from your use of this website and agree to release us from any liability in connection with your use of, or reliance upon, the content or products found herein.