
|
Sungrow Power Supply Co., Ltd. (300274.SZ) DCF Valuation |
Fully Editable: Tailor To Your Needs In Excel Or Sheets
Professional Design: Trusted, Industry-Standard Templates
Investor-Approved Valuation Models
MAC/PC Compatible, Fully Unlocked
No Expertise Is Needed; Easy To Follow
Sungrow Power Supply Co., Ltd. (300274.SZ) Bundle
Evaluate the financial outlook of Sungrow Power Supply Co., Ltd. like an expert! This (300274SZ) DCF Calculator provides pre-filled financial data and full flexibility to modify revenue growth, WACC, margins, and other essential assumptions to align with your projections.
Discounted Cash Flow (DCF) - (USD MM)
| Year | AY1 2020 |
AY2 2021 |
AY3 2022 |
AY4 2023 |
AY5 2024 |
FY1 2025 |
FY2 2026 |
FY3 2027 |
FY4 2028 |
FY5 2029 |
|---|---|---|---|---|---|---|---|---|---|---|
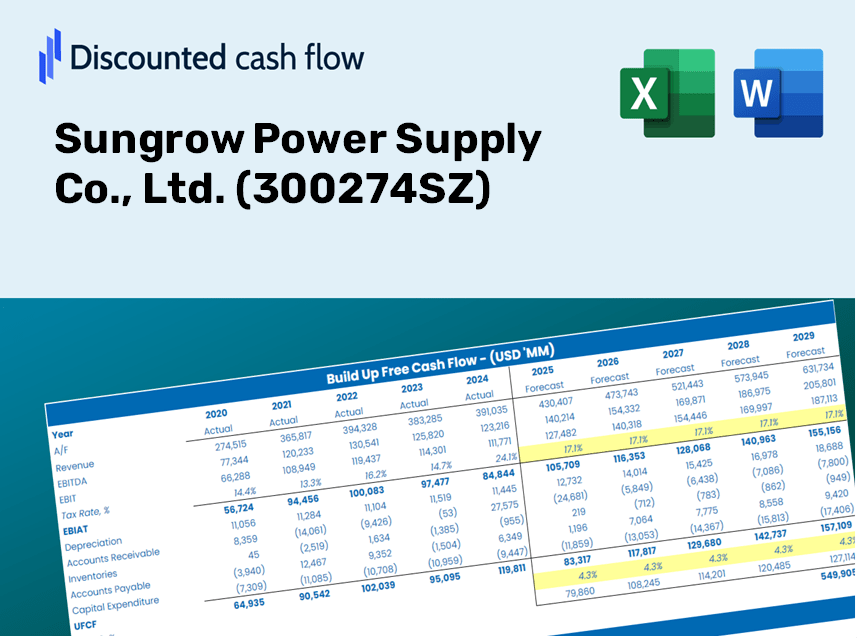
| Revenue | 19,285.6 | 24,136.6 | 40,257.2 | 72,250.7 | 77,857.0 | 112,731.9 | 163,228.6 | 236,344.6 | 342,211.8 | 495,500.8 |
| Revenue Growth, % | 0 | 25.15 | 66.79 | 79.47 | 7.76 | 44.79 | 44.79 | 44.79 | 44.79 | 44.79 |
| EBITDA | 2,512.4 | 2,393.6 | 4,869.8 | 12,568.5 | 14,756.1 | 16,095.7 | 23,305.5 | 33,744.9 | 48,860.4 | 70,746.7 |
| EBITDA, % | 13.03 | 9.92 | 12.1 | 17.4 | 18.95 | 14.28 | 14.28 | 14.28 | 14.28 | 14.28 |
| Depreciation | 242.9 | 347.4 | 467.7 | 610.9 | 819.9 | 1,298.5 | 1,880.2 | 2,722.4 | 3,941.8 | 5,707.5 |
| Depreciation, % | 1.26 | 1.44 | 1.16 | 0.8456 | 1.05 | 1.15 | 1.15 | 1.15 | 1.15 | 1.15 |
| EBIT | 2,269.4 | 2,046.2 | 4,402.1 | 11,957.6 | 13,936.2 | 14,797.1 | 21,425.3 | 31,022.5 | 44,918.5 | 65,039.2 |
| EBIT, % | 11.77 | 8.48 | 10.93 | 16.55 | 17.9 | 13.13 | 13.13 | 13.13 | 13.13 | 13.13 |
| Total Cash | 8,090.5 | 11,603.0 | 13,157.1 | 20,102.7 | 29,964.2 | 42,616.2 | 61,705.5 | 89,345.6 | 129,366.7 | 187,314.7 |
| Total Cash, percent | .0 | .0 | .0 | .0 | .0 | .0 | .0 | .0 | .0 | .0 |
| Account Receivables | 9,802.5 | 11,659.6 | 17,274.2 | 25,981.5 | 33,028.8 | 49,698.3 | 71,960.0 | 104,193.5 | 150,865.5 | 218,443.5 |
| Account Receivables, % | 50.83 | 48.31 | 42.91 | 35.96 | 42.42 | 44.09 | 44.09 | 44.09 | 44.09 | 44.09 |
| Inventories | 3,873.4 | 10,767.5 | 19,060.1 | 21,441.5 | 29,027.6 | 40,358.2 | 58,436.1 | 84,611.8 | 122,512.4 | 177,390.2 |
| Inventories, % | 20.08 | 44.61 | 47.35 | 29.68 | 37.28 | 35.8 | 35.8 | 35.8 | 35.8 | 35.8 |
| Accounts Payable | 12,092.0 | 17,764.8 | 25,926.0 | 28,485.9 | 17,139.3 | 59,103.5 | 85,578.1 | 123,911.6 | 179,416.0 | 259,782.9 |
| Accounts Payable, % | 62.7 | 73.6 | 64.4 | 39.43 | 22.01 | 52.43 | 52.43 | 52.43 | 52.43 | 52.43 |
| Capital Expenditure | -960.9 | -1,665.6 | -1,526.8 | -2,742.6 | -2,786.0 | -5,197.0 | -7,525.0 | -10,895.7 | -15,776.2 | -22,843.0 |
| Capital Expenditure, % | -4.98 | -6.9 | -3.79 | -3.8 | -3.58 | -4.61 | -4.61 | -4.61 | -4.61 | -4.61 |
| Tax Rate, % | 18.52 | 18.52 | 18.52 | 18.52 | 18.52 | 18.52 | 18.52 | 18.52 | 18.52 | 18.52 |
| EBITAT | 2,033.0 | 1,711.1 | 3,826.5 | 9,849.4 | 11,355.6 | 12,547.5 | 18,168.0 | 26,306.1 | 38,089.5 | 55,151.2 |
| Depreciation | ||||||||||
| Changes in Account Receivables | ||||||||||
| Changes in Inventories | ||||||||||
| Changes in Accounts Payable | ||||||||||
| Capital Expenditure | ||||||||||
| UFCF | -269.0 | -2,685.5 | -2,978.6 | -811.0 | -16,590.4 | 22,613.0 | -1,341.8 | -1,942.8 | -2,813.0 | -4,073.1 |
| WACC, % | 7.73 | 7.72 | 7.73 | 7.71 | 7.71 | 7.72 | 7.72 | 7.72 | 7.72 | 7.72 |
| PV UFCF | ||||||||||
| SUM PV UFCF | 13,384.2 | |||||||||
| Long Term Growth Rate, % | 4.00 | |||||||||
| Free cash flow (T + 1) | -4,236 | |||||||||
| Terminal Value | -113,867 | |||||||||
| Present Terminal Value | -78,508 | |||||||||
| Enterprise Value | -65,123 | |||||||||
| Net Debt | -10,407 | |||||||||
| Equity Value | -54,716 | |||||||||
| Diluted Shares Outstanding, MM | 2,074 | |||||||||
| Equity Value Per Share | -26.38 |
What You Will Receive
- Authentic Sungrow Data: Preloaded financial statements – including revenue and EBIT – derived from actual and forecasted metrics.
- Comprehensive Customization: Modify all essential parameters (yellow cells) such as WACC, growth rate, and tax percentages.
- Instant Valuation Adjustments: Automatic recalculations to assess the effects of changes on Sungrow's fair value.
- Flexible Excel Template: Designed for easy modifications, scenario analysis, and in-depth forecasting.
- Efficient and Precise: Avoid constructing models from scratch while ensuring accuracy and adaptability.
Key Features
- Customizable Forecast Variables: Adjust essential factors such as revenue growth, EBITDA %, and capital investments.
- Instant DCF Valuation: Automatically computes intrinsic value, NPV, and additional metrics in real-time.
- High-Precision Accuracy: Leverages Sungrow's actual financial data for reliable valuation results.
- Simplified Scenario Analysis: Effortlessly evaluate various assumptions and analyze different outcomes.
- Efficiency Booster: Removes the necessity of constructing intricate valuation models from the ground up.
How It Functions
- 1. Access the Template: Download and open the Excel file containing Sungrow Power Supply Co., Ltd.'s (300274SZ) preloaded data.
- 2. Modify Assumptions: Adjust essential inputs such as growth rates, WACC, and capital expenditures.
- 3. See Results in Real-Time: The DCF model automatically calculates intrinsic value and NPV.
- 4. Explore Scenarios: Evaluate various forecasts to understand different valuation scenarios.
- 5. Present with Assurance: Share expert valuation insights to bolster your decision-making process.
Why Opt for Sungrow's Calculator?
- All-in-One Solution: Features DCF, WACC, and financial ratio analyses for comprehensive evaluation.
- Tailored Inputs: Modify the yellow-highlighted cells to explore different scenarios.
- In-depth Analysis: Automatically calculates the intrinsic value and Net Present Value for Sungrow (300274SZ).
- Preloaded Information: Historical and projected data provide reliable starting points for analysis.
- High-Quality Standards: Perfect for financial analysts, investors, and business consultants in the renewable energy sector.
Who Can Benefit from Sungrow Power Supply Co., Ltd. (300274SZ)?
- Investors: Enhance your portfolio decisions with a reliable valuation tool tailored for power supply solutions.
- Financial Analysts: Streamline your analytical processes with an easy-to-customize DCF model designed for the energy sector.
- Consultants: Effortlessly modify the framework for impactful client presentations or detailed reports.
- Energy Enthusiasts: Expand your knowledge of valuation methodologies using practical case studies from the power supply industry.
- Educators and Students: Utilize this resource as a hands-on tool for learning in finance and energy-related academic programs.
Contents of the Template
- Preloaded 300274SZ Data: Historical and forecasted financial metrics, including revenue, EBIT, and capital expenditures.
- DCF and WACC Models: Advanced spreadsheets for determining intrinsic value and Weighted Average Cost of Capital.
- Editable Inputs: Yellow-highlighted fields for modifying revenue growth, tax rates, and discount rates.
- Financial Statements: Detailed annual and quarterly financial reports for a thorough analysis.
- Key Ratios: Metrics for profitability, leverage, and efficiency to assess overall performance.
- Dashboard and Charts: Visual representations of valuation results and assumptions.
Disclaimer
All information, articles, and product details provided on this website are for general informational and educational purposes only. We do not claim any ownership over, nor do we intend to infringe upon, any trademarks, copyrights, logos, brand names, or other intellectual property mentioned or depicted on this site. Such intellectual property remains the property of its respective owners, and any references here are made solely for identification or informational purposes, without implying any affiliation, endorsement, or partnership.
We make no representations or warranties, express or implied, regarding the accuracy, completeness, or suitability of any content or products presented. Nothing on this website should be construed as legal, tax, investment, financial, medical, or other professional advice. In addition, no part of this site—including articles or product references—constitutes a solicitation, recommendation, endorsement, advertisement, or offer to buy or sell any securities, franchises, or other financial instruments, particularly in jurisdictions where such activity would be unlawful.
All content is of a general nature and may not address the specific circumstances of any individual or entity. It is not a substitute for professional advice or services. Any actions you take based on the information provided here are strictly at your own risk. You accept full responsibility for any decisions or outcomes arising from your use of this website and agree to release us from any liability in connection with your use of, or reliance upon, the content or products found herein.