
|
Jiangsu Yunyi Electric Co.,Ltd. (300304.SZ) DCF Valuation |
Fully Editable: Tailor To Your Needs In Excel Or Sheets
Professional Design: Trusted, Industry-Standard Templates
Investor-Approved Valuation Models
MAC/PC Compatible, Fully Unlocked
No Expertise Is Needed; Easy To Follow
Jiangsu Yunyi Electric Co.,Ltd. (300304.SZ) Bundle
Explore the financial prospects of Jiangsu Yunyi Electric Co., Ltd. (300304SZ) with our user-friendly DCF Calculator! Enter your assumptions regarding growth, margins, and expenses to calculate the intrinsic value of Jiangsu Yunyi Electric Co., Ltd. (300304SZ) and enhance your investment approach.
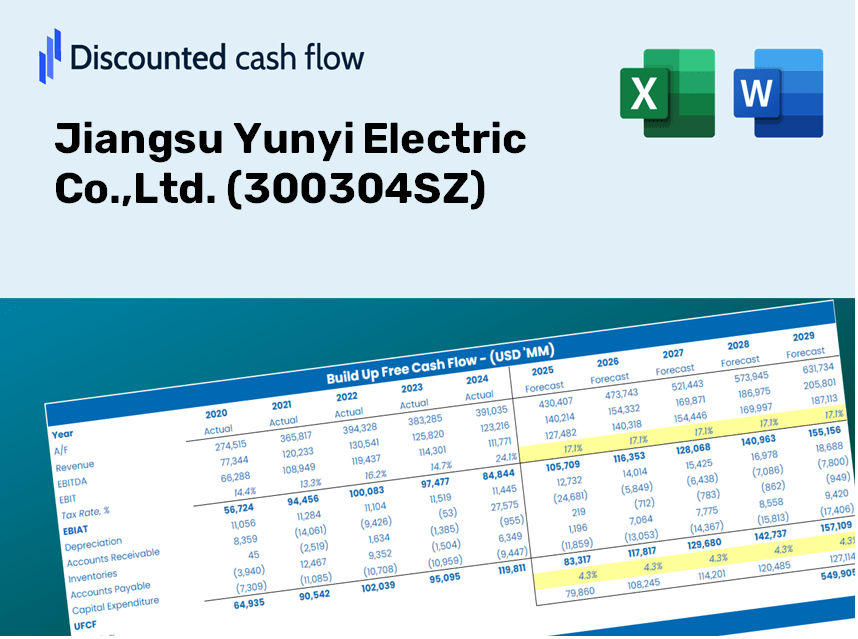
Discounted Cash Flow (DCF) - (USD MM)
| Year | AY1 2020 |
AY2 2021 |
AY3 2022 |
AY4 2023 |
AY5 2024 |
FY1 2025 |
FY2 2026 |
FY3 2027 |
FY4 2028 |
FY5 2029 |
|---|---|---|---|---|---|---|---|---|---|---|
| Revenue | 839.6 | 1,099.3 | 1,174.5 | 1,671.3 | 2,145.0 | 2,726.5 | 3,465.5 | 4,404.8 | 5,598.8 | 7,116.4 |
| Revenue Growth, % | 0 | 30.94 | 6.84 | 42.29 | 28.35 | 27.11 | 27.11 | 27.11 | 27.11 | 27.11 |
| EBITDA | 177.0 | 249.0 | 202.9 | 361.0 | 511.4 | 580.5 | 737.9 | 937.9 | 1,192.1 | 1,515.2 |
| EBITDA, % | 21.09 | 22.65 | 17.28 | 21.6 | 23.84 | 21.29 | 21.29 | 21.29 | 21.29 | 21.29 |
| Depreciation | 65.9 | 73.4 | 77.4 | 77.1 | 74.1 | 159.1 | 202.3 | 257.1 | 326.8 | 415.4 |
| Depreciation, % | 7.85 | 6.68 | 6.59 | 4.61 | 3.45 | 5.84 | 5.84 | 5.84 | 5.84 | 5.84 |
| EBIT | 111.2 | 175.6 | 125.6 | 283.9 | 437.3 | 421.4 | 535.6 | 680.8 | 865.3 | 1,099.9 |
| EBIT, % | 13.24 | 15.97 | 10.69 | 16.99 | 20.39 | 15.46 | 15.46 | 15.46 | 15.46 | 15.46 |
| Total Cash | 1,258.2 | 1,417.5 | 1,265.3 | 1,694.2 | 1,623.3 | 2,593.8 | 3,296.9 | 4,190.6 | 5,326.4 | 6,770.2 |
| Total Cash, percent | .0 | .0 | .0 | .0 | .0 | .0 | .0 | .0 | .0 | .0 |
| Account Receivables | 449.8 | 487.1 | 410.1 | 572.8 | 657.3 | 1,078.1 | 1,370.4 | 1,741.8 | 2,213.9 | 2,814.0 |
| Account Receivables, % | 53.58 | 44.3 | 34.91 | 34.28 | 30.64 | 39.54 | 39.54 | 39.54 | 39.54 | 39.54 |
| Inventories | 221.4 | 320.4 | 385.0 | 393.3 | 452.1 | 724.7 | 921.1 | 1,170.8 | 1,488.2 | 1,891.6 |
| Inventories, % | 26.37 | 29.14 | 32.78 | 23.53 | 21.08 | 26.58 | 26.58 | 26.58 | 26.58 | 26.58 |
| Accounts Payable | 378.9 | 369.7 | 464.6 | 273.9 | 356.6 | 825.2 | 1,048.8 | 1,333.1 | 1,694.5 | 2,153.8 |
| Accounts Payable, % | 45.13 | 33.63 | 39.55 | 16.39 | 16.62 | 30.26 | 30.26 | 30.26 | 30.26 | 30.26 |
| Capital Expenditure | -110.2 | -64.0 | -78.6 | -140.2 | -155.6 | -225.2 | -286.2 | -363.8 | -462.4 | -587.7 |
| Capital Expenditure, % | -13.13 | -5.82 | -6.69 | -8.39 | -7.25 | -8.26 | -8.26 | -8.26 | -8.26 | -8.26 |
| Tax Rate, % | 17.15 | 17.15 | 17.15 | 17.15 | 17.15 | 17.15 | 17.15 | 17.15 | 17.15 | 17.15 |
| EBITAT | 93.5 | 147.0 | 117.2 | 234.2 | 362.3 | 359.4 | 456.8 | 580.6 | 738.0 | 938.1 |
| Depreciation | ||||||||||
| Changes in Account Receivables | ||||||||||
| Changes in Inventories | ||||||||||
| Changes in Accounts Payable | ||||||||||
| Capital Expenditure | ||||||||||
| UFCF | -243.2 | 10.9 | 223.1 | -190.6 | 220.3 | 68.5 | 107.9 | 137.1 | 174.3 | 221.6 |
| WACC, % | 5.46 | 5.46 | 5.46 | 5.46 | 5.46 | 5.46 | 5.46 | 5.46 | 5.46 | 5.46 |
| PV UFCF | ||||||||||
| SUM PV UFCF | 589.6 | |||||||||
| Long Term Growth Rate, % | 2.00 | |||||||||
| Free cash flow (T + 1) | 226 | |||||||||
| Terminal Value | 6,530 | |||||||||
| Present Terminal Value | 5,006 | |||||||||
| Enterprise Value | 5,596 | |||||||||
| Net Debt | -1,266 | |||||||||
| Equity Value | 6,861 | |||||||||
| Diluted Shares Outstanding, MM | 853 | |||||||||
| Equity Value Per Share | 8.04 |
Benefits of Choosing Us
- Genuine 300304SZ Financials: Access to historical and predictive data for precise assessment.
- Customizable Parameters: Adjust WACC, tax rates, revenue growth, and capital investment inputs.
- Real-Time Calculations: Dynamic computation of intrinsic value and NPV.
- Comprehensive Scenario Analysis: Evaluate various scenarios to project Jiangsu Yunyi Electric's future outcomes.
- User-Friendly Design: Designed for industry experts while remaining approachable for newcomers.
Key Features
- 🔍 Real-Life [300304SZ] Financials: Pre-filled historical and projected data for Jiangsu Yunyi Electric Co., Ltd.
- ✏️ Fully Customizable Inputs: Modify all essential parameters (yellow cells) such as WACC, growth %, and tax rates.
- 📊 Professional DCF Valuation: Integrated formulas to compute Jiangsu Yunyi's intrinsic value using the Discounted Cash Flow approach.
- ⚡ Instant Results: Quickly visualize Jiangsu Yunyi's valuation after any adjustments.
- Scenario Analysis: Evaluate and compare different outcomes based on varying financial assumptions side-by-side.
How It Functions
- Step 1: Download the Excel spreadsheet.
- Step 2: Examine the pre-filled data for Jiangsu Yunyi Electric Co., Ltd. (300304SZ).
- Step 3: Modify key assumptions (highlighted in yellow) based on your insights.
- Step 4: Observe automatic updates for Jiangsu Yunyi's intrinsic value.
- Step 5: Utilize the results for investment strategies or reporting purposes.
Why Choose Jiangsu Yunyi Electric Co., Ltd. (300304SZ) Calculator?
- Precision: Leveraging accurate financial data for unparalleled reliability.
- Versatility: Tailored for users to experiment with and adjust inputs effortlessly.
- Efficiency: Eliminate the complexities of starting a DCF model from the ground up.
- High-Quality: Crafted with the expertise and functionality expected at a CFO level.
- Intuitive Design: User-friendly interface, suitable for individuals with minimal financial modeling knowledge.
Who Can Benefit from Jiangsu Yunyi Electric Co., Ltd. (300304SZ)?
- Investors: Make informed investment choices with a sophisticated electric equipment evaluation tool.
- Financial Analysts: Streamline your workflow with a customizable DCF model tailored for the electric industry.
- Consultants: Effortlessly modify the template for client presentations or detailed reports in the electrical sector.
- Industry Enthusiasts: Enhance your understanding of electric equipment valuation through practical real-life examples.
- Educators and Students: Utilize it as an effective learning resource in courses focused on finance and electrical engineering.
Overview of the Template Contents
- Preloaded 300304SZ Data: Historical and projected financial metrics, including revenue, EBIT, and capital expenditures.
- DCF and WACC Models: High-quality spreadsheets for assessing intrinsic value and calculating the Weighted Average Cost of Capital.
- Editable Inputs: Cells highlighted in yellow for modifying revenue growth, tax rates, and discount rates.
- Financial Statements: Detailed annual and quarterly financial documents for thorough analysis.
- Key Ratios: Metrics on profitability, leverage, and efficiency to assess company performance.
- Dashboard and Charts: Visual representations of valuation results and underlying assumptions.
Disclaimer
All information, articles, and product details provided on this website are for general informational and educational purposes only. We do not claim any ownership over, nor do we intend to infringe upon, any trademarks, copyrights, logos, brand names, or other intellectual property mentioned or depicted on this site. Such intellectual property remains the property of its respective owners, and any references here are made solely for identification or informational purposes, without implying any affiliation, endorsement, or partnership.
We make no representations or warranties, express or implied, regarding the accuracy, completeness, or suitability of any content or products presented. Nothing on this website should be construed as legal, tax, investment, financial, medical, or other professional advice. In addition, no part of this site—including articles or product references—constitutes a solicitation, recommendation, endorsement, advertisement, or offer to buy or sell any securities, franchises, or other financial instruments, particularly in jurisdictions where such activity would be unlawful.
All content is of a general nature and may not address the specific circumstances of any individual or entity. It is not a substitute for professional advice or services. Any actions you take based on the information provided here are strictly at your own risk. You accept full responsibility for any decisions or outcomes arising from your use of this website and agree to release us from any liability in connection with your use of, or reliance upon, the content or products found herein.