
|
Shenzhen Microgate Technology Co., Ltd. (300319.SZ) DCF Valuation |
Fully Editable: Tailor To Your Needs In Excel Or Sheets
Professional Design: Trusted, Industry-Standard Templates
Investor-Approved Valuation Models
MAC/PC Compatible, Fully Unlocked
No Expertise Is Needed; Easy To Follow
Shenzhen Microgate Technology Co., Ltd. (300319.SZ) Bundle
Evaluate Shenzhen Microgate Technology Co., Ltd.'s financial outlook like an expert! This (300319SZ) DCF Calculator provides pre-filled financial data along with the flexibility to modify revenue growth, WACC, margins, and other essential assumptions to align with your predictions.
Discounted Cash Flow (DCF) - (USD MM)
| Year | AY1 2020 |
AY2 2021 |
AY3 2022 |
AY4 2023 |
AY5 2024 |
FY1 2025 |
FY2 2026 |
FY3 2027 |
FY4 2028 |
FY5 2029 |
|---|---|---|---|---|---|---|---|---|---|---|
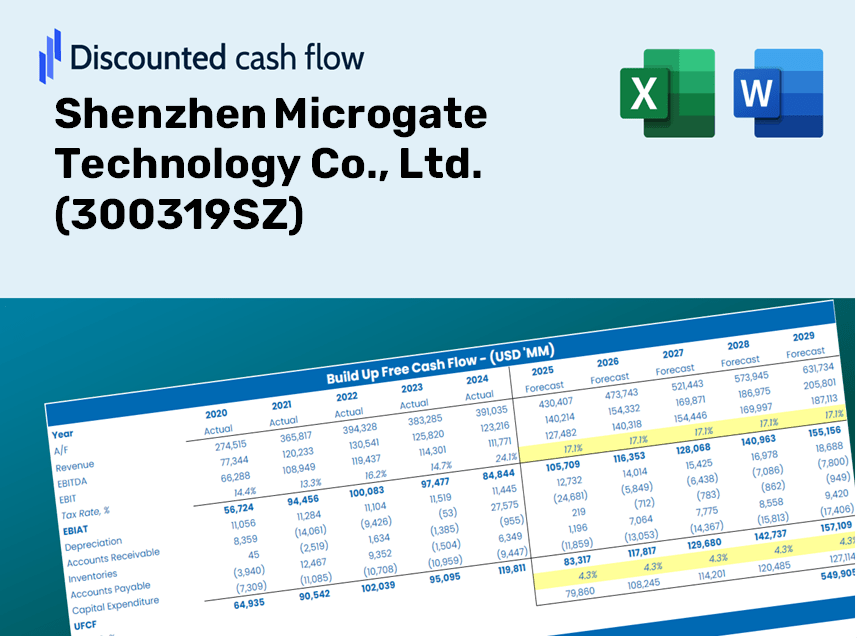
| Revenue | 2,329.2 | 3,318.4 | 3,151.6 | 3,016.7 | 3,150.0 | 3,445.9 | 3,769.7 | 4,123.8 | 4,511.3 | 4,935.1 |
| Revenue Growth, % | 0 | 42.47 | -5.02 | -4.28 | 4.42 | 9.4 | 9.4 | 9.4 | 9.4 | 9.4 |
| EBITDA | 235.2 | 484.1 | 368.0 | 473.0 | 515.9 | 471.5 | 515.8 | 564.3 | 617.3 | 675.3 |
| EBITDA, % | 10.1 | 14.59 | 11.68 | 15.68 | 16.38 | 13.68 | 13.68 | 13.68 | 13.68 | 13.68 |
| Depreciation | 114.3 | 152.1 | 193.7 | 231.5 | 228.0 | 210.6 | 230.3 | 252.0 | 275.7 | 301.6 |
| Depreciation, % | 4.91 | 4.58 | 6.14 | 7.67 | 7.24 | 6.11 | 6.11 | 6.11 | 6.11 | 6.11 |
| EBIT | 120.9 | 331.9 | 174.3 | 241.5 | 287.9 | 261.0 | 285.5 | 312.3 | 341.7 | 373.8 |
| EBIT, % | 5.19 | 10 | 5.53 | 8.01 | 9.14 | 7.57 | 7.57 | 7.57 | 7.57 | 7.57 |
| Total Cash | 542.9 | 1,350.4 | 1,042.2 | 685.6 | 758.7 | 991.6 | 1,084.8 | 1,186.7 | 1,298.2 | 1,420.2 |
| Total Cash, percent | .0 | .0 | .0 | .0 | .0 | .0 | .0 | .0 | .0 | .0 |
| Account Receivables | 829.9 | 1,202.0 | 1,027.5 | 1,076.2 | 1,331.2 | 1,257.0 | 1,375.1 | 1,504.3 | 1,645.6 | 1,800.3 |
| Account Receivables, % | 35.63 | 36.22 | 32.6 | 35.68 | 42.26 | 36.48 | 36.48 | 36.48 | 36.48 | 36.48 |
| Inventories | 527.3 | 583.9 | 466.2 | 408.7 | 473.3 | 576.2 | 630.3 | 689.5 | 754.3 | 825.2 |
| Inventories, % | 22.64 | 17.6 | 14.79 | 13.55 | 15.02 | 16.72 | 16.72 | 16.72 | 16.72 | 16.72 |
| Accounts Payable | 721.5 | 1,173.9 | 1,019.7 | 1,098.7 | 1,428.2 | 1,243.8 | 1,360.6 | 1,488.4 | 1,628.3 | 1,781.3 |
| Accounts Payable, % | 30.98 | 35.38 | 32.36 | 36.42 | 45.34 | 36.09 | 36.09 | 36.09 | 36.09 | 36.09 |
| Capital Expenditure | -316.2 | -641.7 | -257.3 | -150.5 | -368.6 | -398.1 | -435.5 | -476.5 | -521.2 | -570.2 |
| Capital Expenditure, % | -13.57 | -19.34 | -8.16 | -4.99 | -11.7 | -11.55 | -11.55 | -11.55 | -11.55 | -11.55 |
| Tax Rate, % | 11.19 | 11.19 | 11.19 | 11.19 | 11.19 | 11.19 | 11.19 | 11.19 | 11.19 | 11.19 |
| EBITAT | 81.6 | 291.6 | 139.7 | 209.6 | 255.7 | 214.6 | 234.7 | 256.8 | 280.9 | 307.3 |
| Depreciation | ||||||||||
| Changes in Account Receivables | ||||||||||
| Changes in Inventories | ||||||||||
| Changes in Accounts Payable | ||||||||||
| Capital Expenditure | ||||||||||
| UFCF | -755.9 | -174.3 | 214.2 | 378.3 | 125.0 | -186.1 | -25.8 | -28.3 | -30.9 | -33.8 |
| WACC, % | 4.6 | 4.62 | 4.61 | 4.62 | 4.62 | 4.61 | 4.61 | 4.61 | 4.61 | 4.61 |
| PV UFCF | ||||||||||
| SUM PV UFCF | -279.0 | |||||||||
| Long Term Growth Rate, % | 3.00 | |||||||||
| Free cash flow (T + 1) | -35 | |||||||||
| Terminal Value | -2,161 | |||||||||
| Present Terminal Value | -1,725 | |||||||||
| Enterprise Value | -2,004 | |||||||||
| Net Debt | -32 | |||||||||
| Equity Value | -1,972 | |||||||||
| Diluted Shares Outstanding, MM | 869 | |||||||||
| Equity Value Per Share | -2.27 |
What You'll Receive
- Authentic 300319SZ Financial Data: Pre-populated with Shenzhen Microgate's historical and projected figures for accurate assessment.
- Completely Customizable Template: Easily adjust key parameters such as revenue growth, WACC, and EBITDA %.
- Real-Time Calculations: Watch Shenzhen Microgate's intrinsic value reflect your modifications instantly.
- Professional Valuation Tool: Tailored for investors, analysts, and consultants aiming for precise DCF outcomes.
- User-Friendly Interface: Intuitive layout and straightforward instructions for users of all expertise levels.
Key Features
- Customizable Forecast Parameters: Adjust essential inputs such as revenue growth, EBITDA %, and capital expenditures for accurate projections.
- Instant DCF Valuation: Quickly computes intrinsic value, NPV, and other financial metrics with ease.
- High-Precision Accuracy: Leverages Shenzhen Microgate Technology Co., Ltd.'s (300319SZ) actual financial data for credible valuation results.
- Simplified Scenario Analysis: Easily evaluate different assumptions and analyze various potential outcomes.
- Efficient Valuation Tool: Streamline your analysis by eliminating the need for complex valuation model development from scratch.
How It Works
- Step 1: Download the Excel file.
- Step 2: Review the pre-filled data for Shenzhen Microgate Technology Co., Ltd. (300319SZ), including both historical and projected figures.
- Step 3: Modify the key assumptions (marked in yellow cells) based on your analysis.
- Step 4: Observe the automatic recalculations for the intrinsic value of Shenzhen Microgate Technology Co., Ltd. (300319SZ).
- Step 5: Utilize the results for investment decision-making or reporting purposes.
Why Opt for Shenzhen Microgate Technology Co., Ltd. ([300319SZ])?
- Streamline Your Process: Utilize our solutions without the hassle of starting from scratch.
- Enhance Precision: Dependable data and methodologies minimize valuation errors.
- Completely Customizable: Adjust the model to align with your specific assumptions and forecasts.
- User-Friendly Design: Intuitive charts and outputs simplify result interpretation.
- Preferred by Professionals: Crafted for experts who prioritize accuracy and functionality.
Who Can Benefit from Shenzhen Microgate Technology Co., Ltd. (300319SZ)?
- Investors: Make informed decisions with a professional-level analysis tool tailored for the tech industry.
- Financial Analysts: Streamline your analysis with our pre-configured models that are easily customizable.
- Consultants: Effortlessly modify our resources for client reports or presentations.
- Tech Enthusiasts: Enhance your knowledge of technology valuation methods through practical, real-world cases.
- Educators and Students: Utilize this as a hands-on learning resource in technology and finance courses.
Contents of the Template
- Operating and Balance Sheet Data: Pre-filled historical data and forecasts for Shenzhen Microgate Technology Co., Ltd. (300319SZ), including metrics such as revenue, EBITDA, EBIT, and capital expenditures.
- WACC Calculation: A specific sheet dedicated to calculating the Weighted Average Cost of Capital (WACC), featuring essential parameters like Beta, risk-free rate, and share price.
- DCF Valuation (Unlevered and Levered): Customizable Discounted Cash Flow models that detail the intrinsic value with thorough calculations.
- Financial Statements: Pre-loaded financial statements (both annual and quarterly) to facilitate comprehensive analysis.
- Key Ratios: A collection of key profitability, leverage, and efficiency ratios specific to Shenzhen Microgate Technology Co., Ltd. (300319SZ).
- Dashboard and Charts: A visual overview of valuation outputs and assumptions to streamline result analysis.
Disclaimer
All information, articles, and product details provided on this website are for general informational and educational purposes only. We do not claim any ownership over, nor do we intend to infringe upon, any trademarks, copyrights, logos, brand names, or other intellectual property mentioned or depicted on this site. Such intellectual property remains the property of its respective owners, and any references here are made solely for identification or informational purposes, without implying any affiliation, endorsement, or partnership.
We make no representations or warranties, express or implied, regarding the accuracy, completeness, or suitability of any content or products presented. Nothing on this website should be construed as legal, tax, investment, financial, medical, or other professional advice. In addition, no part of this site—including articles or product references—constitutes a solicitation, recommendation, endorsement, advertisement, or offer to buy or sell any securities, franchises, or other financial instruments, particularly in jurisdictions where such activity would be unlawful.
All content is of a general nature and may not address the specific circumstances of any individual or entity. It is not a substitute for professional advice or services. Any actions you take based on the information provided here are strictly at your own risk. You accept full responsibility for any decisions or outcomes arising from your use of this website and agree to release us from any liability in connection with your use of, or reliance upon, the content or products found herein.