
|
Top Resource Conservation & Environment Corp. (300332.SZ) DCF Valuation |
Fully Editable: Tailor To Your Needs In Excel Or Sheets
Professional Design: Trusted, Industry-Standard Templates
Investor-Approved Valuation Models
MAC/PC Compatible, Fully Unlocked
No Expertise Is Needed; Easy To Follow
Top Resource Conservation & Environment Corp. (300332.SZ) Bundle
Evaluate the financial outlook of Top Resource Conservation & Environment Corp. like an expert! This (300332SZ) DCF Calculator provides pre-filled financial data along with the flexibility to modify revenue growth, WACC, margins, and other essential assumptions to align with your projections.
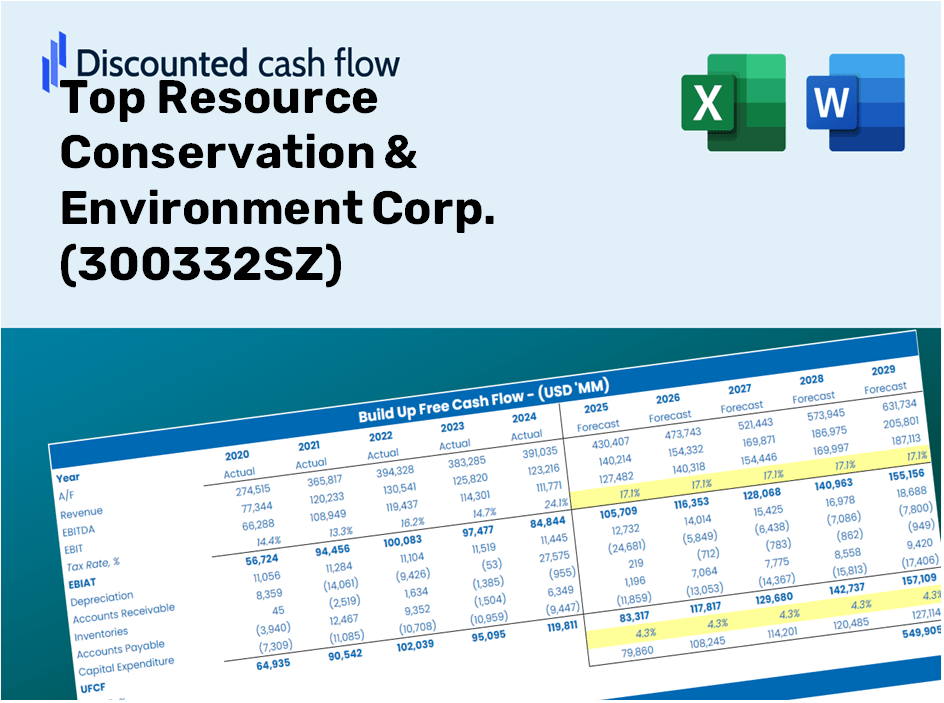
Discounted Cash Flow (DCF) - (USD MM)
| Year | AY1 2020 |
AY2 2021 |
AY3 2022 |
AY4 2023 |
AY5 2024 |
FY1 2025 |
FY2 2026 |
FY3 2027 |
FY4 2028 |
FY5 2029 |
|---|---|---|---|---|---|---|---|---|---|---|
| Revenue | 1,693.7 | 2,052.0 | 3,841.8 | 4,522.0 | 3,843.9 | 4,911.4 | 6,275.4 | 8,018.2 | 10,245.1 | 13,090.4 |
| Revenue Growth, % | 0 | 21.16 | 87.23 | 17.7 | -15 | 27.77 | 27.77 | 27.77 | 27.77 | 27.77 |
| EBITDA | 449.2 | 517.0 | 798.6 | 698.2 | 378.2 | 960.5 | 1,227.3 | 1,568.2 | 2,003.7 | 2,560.1 |
| EBITDA, % | 26.53 | 25.2 | 20.79 | 15.44 | 9.84 | 19.56 | 19.56 | 19.56 | 19.56 | 19.56 |
| Depreciation | 244.2 | 168.9 | 187.3 | 188.0 | 189.8 | 359.7 | 459.6 | 587.2 | 750.3 | 958.6 |
| Depreciation, % | 14.42 | 8.23 | 4.87 | 4.16 | 4.94 | 7.32 | 7.32 | 7.32 | 7.32 | 7.32 |
| EBIT | 205.1 | 348.1 | 611.3 | 510.2 | 188.5 | 600.9 | 767.7 | 981.0 | 1,253.4 | 1,601.5 |
| EBIT, % | 12.11 | 16.96 | 15.91 | 11.28 | 4.9 | 12.23 | 12.23 | 12.23 | 12.23 | 12.23 |
| Total Cash | 1,322.0 | 924.3 | 1,741.7 | 1,532.7 | 1,108.0 | 2,270.6 | 2,901.2 | 3,706.9 | 4,736.5 | 6,051.9 |
| Total Cash, percent | .0 | .0 | .0 | .0 | .0 | .0 | .0 | .0 | .0 | .0 |
| Account Receivables | 1,428.4 | 1,269.8 | 901.0 | 1,041.4 | 568.7 | 2,038.2 | 2,604.2 | 3,327.5 | 4,251.6 | 5,432.4 |
| Account Receivables, % | 84.33 | 61.88 | 23.45 | 23.03 | 14.79 | 41.5 | 41.5 | 41.5 | 41.5 | 41.5 |
| Inventories | 76.2 | 114.2 | 115.0 | 153.6 | 74.1 | 180.6 | 230.7 | 294.8 | 376.6 | 481.3 |
| Inventories, % | 4.5 | 5.57 | 2.99 | 3.4 | 1.93 | 3.68 | 3.68 | 3.68 | 3.68 | 3.68 |
| Accounts Payable | 1,997.3 | 1,950.1 | 2,069.0 | 1,929.2 | 1,628.2 | 3,279.9 | 4,190.8 | 5,354.7 | 6,841.8 | 8,742.0 |
| Accounts Payable, % | 117.93 | 95.03 | 53.85 | 42.66 | 42.36 | 66.78 | 66.78 | 66.78 | 66.78 | 66.78 |
| Capital Expenditure | -245.9 | -342.2 | -313.6 | -403.7 | -259.0 | -540.4 | -690.5 | -882.3 | -1,127.3 | -1,440.4 |
| Capital Expenditure, % | -14.52 | -16.67 | -8.16 | -8.93 | -6.74 | -11 | -11 | -11 | -11 | -11 |
| Tax Rate, % | -5.26 | -5.26 | -5.26 | -5.26 | -5.26 | -5.26 | -5.26 | -5.26 | -5.26 | -5.26 |
| EBITAT | 231.8 | 301.7 | 422.0 | 287.5 | 198.4 | 495.2 | 632.7 | 808.4 | 1,033.0 | 1,319.8 |
| Depreciation | ||||||||||
| Changes in Account Receivables | ||||||||||
| Changes in Inventories | ||||||||||
| Changes in Accounts Payable | ||||||||||
| Capital Expenditure | ||||||||||
| UFCF | 722.8 | 201.7 | 782.7 | -246.9 | 380.4 | 390.2 | 696.5 | 889.9 | 1,137.0 | 1,452.8 |
| WACC, % | 5.03 | 4.86 | 4.64 | 4.48 | 5.03 | 4.81 | 4.81 | 4.81 | 4.81 | 4.81 |
| PV UFCF | ||||||||||
| SUM PV UFCF | 3,870.3 | |||||||||
| Long Term Growth Rate, % | 3.50 | |||||||||
| Free cash flow (T + 1) | 1,504 | |||||||||
| Terminal Value | 114,910 | |||||||||
| Present Terminal Value | 90,860 | |||||||||
| Enterprise Value | 94,730 | |||||||||
| Net Debt | -22 | |||||||||
| Equity Value | 94,752 | |||||||||
| Diluted Shares Outstanding, MM | 832 | |||||||||
| Equity Value Per Share | 113.88 |
What You Will Receive
- Actual Financial Data: Comprehensive financials – including revenue and EBIT – derived from real and forecasted data.
- Complete Customization: Modify all essential parameters (yellow cells) such as WACC, growth rates, and tax percentages.
- Immediate Valuation Adjustments: Automatic updates that allow you to assess how changes affect the fair value of Top Resource Conservation & Environment Corp. (300332SZ).
- Flexible Excel Template: Designed for swift modifications, scenario analysis, and in-depth forecasting.
- Efficient and Reliable: Eliminate the need to create models from the ground up while ensuring accuracy and adaptability.
Key Features
- 🔍 Real-Life TRCE Financials: Pre-filled historical and projected data for Top Resource Conservation & Environment Corp. (300332SZ).
- ✏️ Fully Customizable Inputs: Modify all essential parameters (yellow cells) such as WACC, growth %, and tax rates.
- 📊 Professional DCF Valuation: Integrated formulas compute TRCE’s intrinsic value utilizing the Discounted Cash Flow method.
- ⚡ Instant Results: View TRCE’s valuation immediately after making adjustments.
- Scenario Analysis: Evaluate and compare results for different financial assumptions side-by-side.
How It Works
- Step 1: Download the Excel file.
- Step 2: Analyze the pre-filled data for Top Resource Conservation & Environment Corp. (300332SZ) [Symbol], including historical and projected figures.
- Step 3: Modify key assumptions (highlighted in yellow) based on your findings.
- Step 4: Observe the automatic recalculations reflecting the intrinsic value of Top Resource Conservation & Environment Corp. (300332SZ) [Symbol].
- Step 5: Utilize the generated outputs for making informed investment choices or for reporting purposes.
Why Choose This Calculator for Top Resource Conservation & Environment Corp. (300332SZ)?
- User-Friendly Interface: Crafted for both novices and seasoned users.
- Customizable Inputs: Adjust parameters to suit your specific analysis needs.
- Real-Time Updates: Instantly view changes in Top Resource Conservation’s valuation as you modify inputs.
- Pre-Loaded Data: Comes equipped with Top Resource Conservation’s actual financial metrics for swift analysis.
- Relied Upon by Experts: Favored by investors and analysts for making well-informed decisions.
Who Can Benefit from Our Services?
- Investors: Make informed choices with our expert-level resource conservation tools.
- Environmental Analysts: Streamline your work with a customizable framework tailored for sustainability assessments.
- Consultants: Adapt our templates swiftly for impactful client presentations or sustainability reports.
- Eco-Enthusiasts: Enhance your knowledge of conservation practices through practical, real-life case studies.
- Educators and Students: Utilize our resources as a hands-on learning tool in environmental and conservation courses.
Contents of the Template
- Historical Data: Contains past financial information and baseline forecasts for Top Resource Conservation & Environment Corp. (300332SZ).
- DCF and Levered DCF Models: Comprehensive templates designed to calculate the intrinsic value of Top Resource Conservation & Environment Corp. (300332SZ).
- WACC Sheet: Pre-configured calculations for the Weighted Average Cost of Capital.
- Editable Inputs: Adjust key parameters such as growth rates, EBITDA %, and CAPEX assumptions.
- Quarterly and Annual Statements: A thorough breakdown of financials for Top Resource Conservation & Environment Corp. (300332SZ).
- Interactive Dashboard: Dynamically visualize valuation results and future projections.
Disclaimer
All information, articles, and product details provided on this website are for general informational and educational purposes only. We do not claim any ownership over, nor do we intend to infringe upon, any trademarks, copyrights, logos, brand names, or other intellectual property mentioned or depicted on this site. Such intellectual property remains the property of its respective owners, and any references here are made solely for identification or informational purposes, without implying any affiliation, endorsement, or partnership.
We make no representations or warranties, express or implied, regarding the accuracy, completeness, or suitability of any content or products presented. Nothing on this website should be construed as legal, tax, investment, financial, medical, or other professional advice. In addition, no part of this site—including articles or product references—constitutes a solicitation, recommendation, endorsement, advertisement, or offer to buy or sell any securities, franchises, or other financial instruments, particularly in jurisdictions where such activity would be unlawful.
All content is of a general nature and may not address the specific circumstances of any individual or entity. It is not a substitute for professional advice or services. Any actions you take based on the information provided here are strictly at your own risk. You accept full responsibility for any decisions or outcomes arising from your use of this website and agree to release us from any liability in connection with your use of, or reliance upon, the content or products found herein.