
|
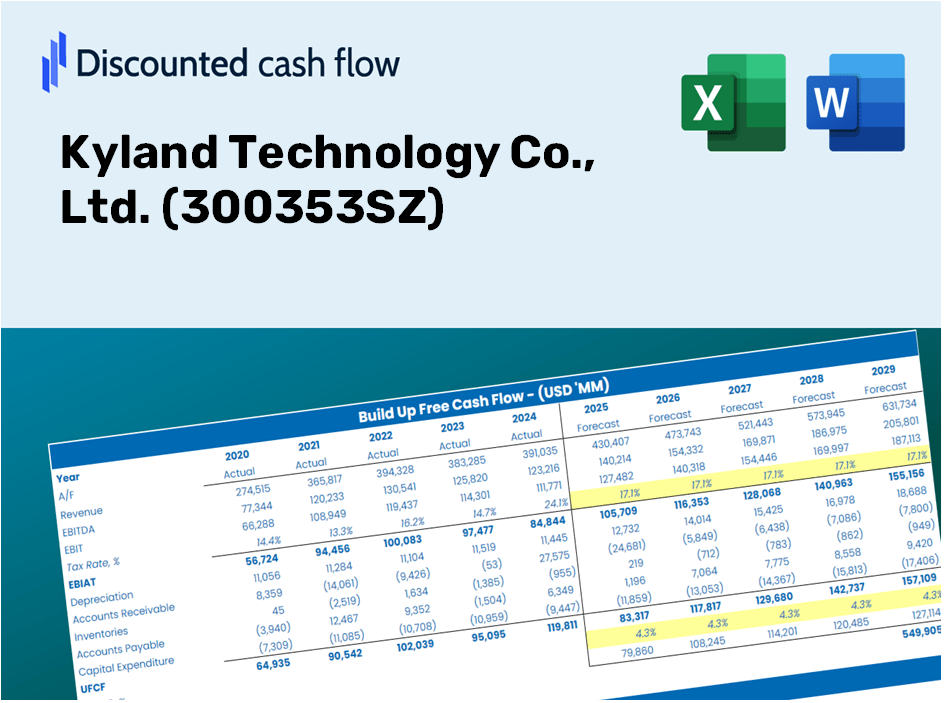
Kyland Technology Co., Ltd. (300353.SZ) DCF Valuation |
- ✓ Fully Editable: Tailor To Your Needs In Excel Or Sheets
- ✓ Professional Design: Trusted, Industry-Standard Templates
- ✓ Pre-Built For Quick And Efficient Use
- ✓ No Expertise Is Needed; Easy To Follow
Kyland Technology Co., Ltd. (300353.SZ) Bundle
Explore Kyland Technology Co., Ltd.'s (300353SZ) financial future with our user-friendly DCF Calculator! Enter your projections for growth, margins, and expenses to calculate Kyland Technology Co., Ltd.'s (300353SZ) intrinsic value and enhance your investment strategy.
Discounted Cash Flow (DCF) - (USD MM)
| Year | AY1 2020 |
AY2 2021 |
AY3 2022 |
AY4 2023 |
AY5 2024 |
FY1 2025 |
FY2 2026 |
FY3 2027 |
FY4 2028 |
FY5 2029 |
|---|---|---|---|---|---|---|---|---|---|---|
| Revenue | 535.0 | 941.0 | 1,104.7 | 1,163.1 | 1,029.1 | 1,253.1 | 1,525.9 | 1,858.0 | 2,262.5 | 2,754.9 |
| Revenue Growth, % | 0 | 75.9 | 17.4 | 5.28 | -11.52 | 21.77 | 21.77 | 21.77 | 21.77 | 21.77 |
| EBITDA | -799.5 | 140.4 | 151.6 | 401.9 | 171.4 | -50.5 | -61.5 | -74.9 | -91.2 | -111.0 |
| EBITDA, % | -149.45 | 14.92 | 13.72 | 34.55 | 16.66 | -4.03 | -4.03 | -4.03 | -4.03 | -4.03 |
| Depreciation | 62.4 | 74.7 | 81.5 | 99.6 | 99.5 | 113.3 | 138.0 | 168.0 | 204.6 | 249.1 |
| Depreciation, % | 11.66 | 7.94 | 7.38 | 8.56 | 9.67 | 9.04 | 9.04 | 9.04 | 9.04 | 9.04 |
| EBIT | -861.8 | 65.7 | 70.0 | 302.3 | 71.9 | -134.6 | -163.9 | -199.6 | -243.0 | -295.9 |
| EBIT, % | -161.1 | 6.99 | 6.34 | 25.99 | 6.99 | -10.74 | -10.74 | -10.74 | -10.74 | -10.74 |
| Total Cash | 605.6 | 380.4 | 309.3 | 812.0 | 661.7 | 758.2 | 923.3 | 1,124.2 | 1,368.9 | 1,666.9 |
| Total Cash, percent | .0 | .0 | .0 | .0 | .0 | .0 | .0 | .0 | .0 | .0 |
| Account Receivables | 604.4 | 680.1 | 782.2 | 928.7 | .0 | 809.4 | 985.5 | 1,200.1 | 1,461.3 | 1,779.4 |
| Account Receivables, % | 112.98 | 72.28 | 70.81 | 79.85 | 0.000000194 | 64.59 | 64.59 | 64.59 | 64.59 | 64.59 |
| Inventories | 194.4 | 258.9 | 419.4 | 383.1 | 358.2 | 425.0 | 517.5 | 630.1 | 767.2 | 934.3 |
| Inventories, % | 36.34 | 27.51 | 37.96 | 32.94 | 34.81 | 33.91 | 33.91 | 33.91 | 33.91 | 33.91 |
| Accounts Payable | 324.7 | 264.9 | 498.7 | 413.7 | 429.2 | 529.5 | 644.7 | 785.0 | 955.9 | 1,164.0 |
| Accounts Payable, % | 60.69 | 28.15 | 45.14 | 35.57 | 41.71 | 42.25 | 42.25 | 42.25 | 42.25 | 42.25 |
| Capital Expenditure | -77.8 | -91.3 | -106.1 | -130.9 | -137.1 | -146.4 | -178.3 | -217.1 | -264.4 | -321.9 |
| Capital Expenditure, % | -14.54 | -9.7 | -9.61 | -11.26 | -13.32 | -11.69 | -11.69 | -11.69 | -11.69 | -11.69 |
| Tax Rate, % | 10.2 | 10.2 | 10.2 | 10.2 | 10.2 | 10.2 | 10.2 | 10.2 | 10.2 | 10.2 |
| EBITAT | -832.2 | -31.6 | 51.3 | 305.4 | 64.6 | -96.8 | -117.9 | -143.5 | -174.8 | -212.8 |
| Depreciation | ||||||||||
| Changes in Account Receivables | ||||||||||
| Changes in Inventories | ||||||||||
| Changes in Accounts Payable | ||||||||||
| Capital Expenditure | ||||||||||
| UFCF | -1,321.8 | -248.1 | -2.0 | 78.7 | 996.3 | -905.8 | -311.6 | -379.5 | -462.1 | -562.6 |
| WACC, % | 9.05 | 8.78 | 8.99 | 9.06 | 9.03 | 8.98 | 8.98 | 8.98 | 8.98 | 8.98 |
| PV UFCF | ||||||||||
| SUM PV UFCF | -2,080.2 | |||||||||
| Long Term Growth Rate, % | 2.00 | |||||||||
| Free cash flow (T + 1) | -574 | |||||||||
| Terminal Value | -8,217 | |||||||||
| Present Terminal Value | -5,344 | |||||||||
| Enterprise Value | -7,424 | |||||||||
| Net Debt | 199 | |||||||||
| Equity Value | -7,623 | |||||||||
| Diluted Shares Outstanding, MM | 615 | |||||||||
| Equity Value Per Share | -12.40 |
Benefits You Will Receive
- Authentic Kyland Financials: Access both historical and projected data for precise valuation.
- Customizable Inputs: Adjust parameters such as WACC, tax rates, revenue growth, and capital expenditures.
- Real-Time Calculations: Automatically calculates intrinsic value and NPV.
- Scenario Testing: Evaluate various scenarios to assess the future performance of Kyland Technology (300353SZ).
- User-Friendly Interface: Designed for experts while remaining accessible to newcomers.
Key Features of Kyland Technology (300353SZ)
- Comprehensive Financial Insights: Gain access to precise historical data and future forecasts tailored for Kyland Technology.
- Adaptable Forecast Parameters: Modify highlighted sections for inputs like WACC, growth rates, and profit margins.
- Real-time Calculations: Enjoy automatic updates to DCF, Net Present Value (NPV), and cash flow evaluations.
- Intuitive Visualization Tools: Utilize easy-to-understand charts and summaries to present your valuation findings.
- Designed for All Skill Levels: A user-friendly layout suitable for investors, CFOs, and consultants alike.
How It Works
- Download the Template: Gain immediate access to the Excel-based Kyland Technology DCF Calculator.
- Input Your Assumptions: Modify the yellow-highlighted cells for growth rates, WACC, profit margins, and other variables.
- Instant Calculations: The model will automatically compute Kyland Technology's intrinsic value.
- Test Scenarios: Experiment with different assumptions to assess the impact on valuation.
- Analyze and Decide: Leverage the results to inform your investment strategy or financial analysis.
Why Opt for This Calculator?
- User-Friendly Interface: Crafted for both novices and seasoned professionals.
- Customizable Parameters: Adjust inputs effortlessly to suit your assessment needs.
- Real-Time Updates: Observe immediate changes in Kyland Technology's valuation as you alter inputs.
- Preloaded Financials: Comes with Kyland Technology's actual financial data for swift analysis.
- Relied Upon by Experts: Employed by investors and analysts for informed decision-making.
Who Can Benefit from Kyland Technology Co., Ltd. (300353SZ)?
- Investors: Make informed investment choices with our advanced valuation tools tailored for precision.
- Financial Analysts: Streamline your analysis with a customizable DCF model that saves valuable time.
- Consultants: Easily modify our templates for client presentations and detailed reports.
- Finance Enthusiasts: Enhance your knowledge of valuation methodologies with practical, real-world insights.
- Educators and Students: Utilize it as an effective educational resource for finance courses and projects.
Contents of the Template
- Operating and Balance Sheet Data: Pre-filled historical data and forecasts for Kyland Technology Co., Ltd. (300353SZ), including revenue, EBITDA, EBIT, and capital expenditures.
- WACC Calculation: A dedicated sheet for calculating the Weighted Average Cost of Capital (WACC), incorporating parameters such as Beta, risk-free rate, and share price.
- DCF Valuation (Unlevered and Levered): Customizable Discounted Cash Flow models that provide intrinsic value along with comprehensive calculations.
- Financial Statements: Pre-loaded financial statements (annual and quarterly) to enhance analysis for Kyland Technology Co., Ltd. (300353SZ).
- Key Ratios: A compilation of profitability, leverage, and efficiency ratios relevant to Kyland Technology Co., Ltd. (300353SZ).
- Dashboard and Charts: Visual representations of valuation outputs and assumptions to facilitate result analysis.
Disclaimer
All information, articles, and product details provided on this website are for general informational and educational purposes only. We do not claim any ownership over, nor do we intend to infringe upon, any trademarks, copyrights, logos, brand names, or other intellectual property mentioned or depicted on this site. Such intellectual property remains the property of its respective owners, and any references here are made solely for identification or informational purposes, without implying any affiliation, endorsement, or partnership.
We make no representations or warranties, express or implied, regarding the accuracy, completeness, or suitability of any content or products presented. Nothing on this website should be construed as legal, tax, investment, financial, medical, or other professional advice. In addition, no part of this site—including articles or product references—constitutes a solicitation, recommendation, endorsement, advertisement, or offer to buy or sell any securities, franchises, or other financial instruments, particularly in jurisdictions where such activity would be unlawful.
All content is of a general nature and may not address the specific circumstances of any individual or entity. It is not a substitute for professional advice or services. Any actions you take based on the information provided here are strictly at your own risk. You accept full responsibility for any decisions or outcomes arising from your use of this website and agree to release us from any liability in connection with your use of, or reliance upon, the content or products found herein.