
|
NSFOCUS Technologies Group Co., Ltd. (300369.SZ) DCF Valuation |
Fully Editable: Tailor To Your Needs In Excel Or Sheets
Professional Design: Trusted, Industry-Standard Templates
Investor-Approved Valuation Models
MAC/PC Compatible, Fully Unlocked
No Expertise Is Needed; Easy To Follow
NSFOCUS Technologies Group Co., Ltd. (300369.SZ) Bundle
Looking to determine the intrinsic value of NSFOCUS Technologies Group Co., Ltd.? Our (300369SZ) DCF Calculator integrates real-world data with extensive customization options, enabling you to adjust forecasts and enhance your investment strategies.
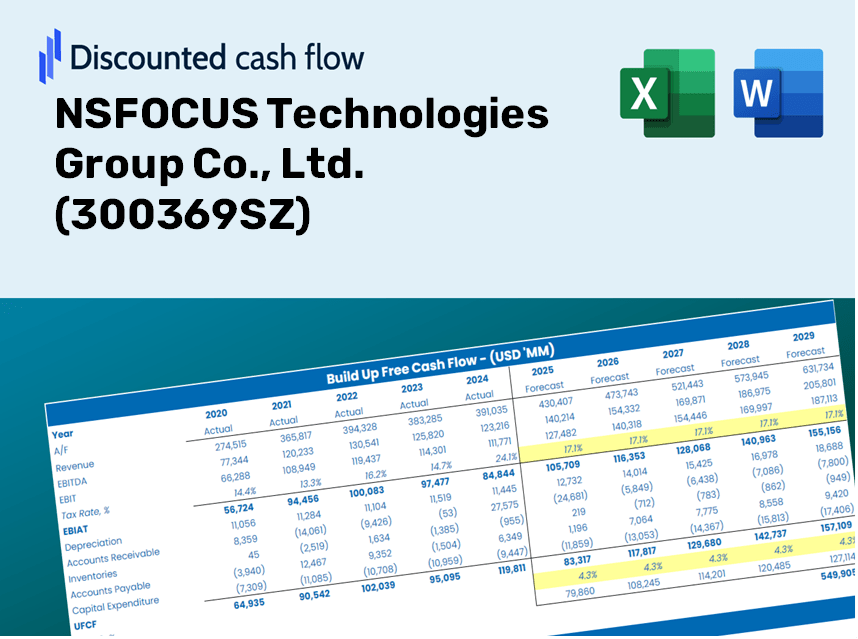
Discounted Cash Flow (DCF) - (USD MM)
| Year | AY1 2020 |
AY2 2021 |
AY3 2022 |
AY4 2023 |
AY5 2024 |
FY1 2025 |
FY2 2026 |
FY3 2027 |
FY4 2028 |
FY5 2029 |
|---|---|---|---|---|---|---|---|---|---|---|
| Revenue | 2,010.0 | 2,609.0 | 2,628.8 | 1,680.8 | 2,358.0 | 2,563.1 | 2,786.0 | 3,028.3 | 3,291.6 | 3,577.9 |
| Revenue Growth, % | 0 | 29.8 | 0.76057 | -36.06 | 40.29 | 8.7 | 8.7 | 8.7 | 8.7 | 8.7 |
| EBITDA | 446.8 | 545.9 | 235.8 | -810.4 | -99.4 | -1.6 | -1.7 | -1.9 | -2.0 | -2.2 |
| EBITDA, % | 22.23 | 20.92 | 8.97 | -48.21 | -4.21 | -0.06162296 | -0.06162296 | -0.06162296 | -0.06162296 | -0.06162296 |
| Depreciation | 111.3 | 166.2 | 212.9 | 227.6 | 249.6 | 226.2 | 245.9 | 267.3 | 290.6 | 315.8 |
| Depreciation, % | 5.54 | 6.37 | 8.1 | 13.54 | 10.59 | 8.83 | 8.83 | 8.83 | 8.83 | 8.83 |
| EBIT | 335.5 | 379.7 | 22.8 | -1,038.0 | -349.0 | -227.8 | -247.6 | -269.2 | -292.6 | -318.0 |
| EBIT, % | 16.69 | 14.55 | 0.86917 | -61.76 | -14.8 | -8.89 | -8.89 | -8.89 | -8.89 | -8.89 |
| Total Cash | 1,707.2 | 1,197.7 | 924.4 | 744.1 | 621.5 | 1,213.0 | 1,318.5 | 1,433.2 | 1,557.8 | 1,693.3 |
| Total Cash, percent | .0 | .0 | .0 | .0 | .0 | .0 | .0 | .0 | .0 | .0 |
| Account Receivables | 1,297.5 | 1,695.5 | 1,919.4 | 1,477.0 | 1,695.3 | 1,857.3 | 2,018.8 | 2,194.4 | 2,385.2 | 2,592.7 |
| Account Receivables, % | 64.55 | 64.99 | 73.01 | 87.87 | 71.9 | 72.46 | 72.46 | 72.46 | 72.46 | 72.46 |
| Inventories | 64.8 | 147.7 | 281.8 | 190.2 | 77.6 | 175.3 | 190.6 | 207.2 | 225.2 | 244.8 |
| Inventories, % | 3.22 | 5.66 | 10.72 | 11.31 | 3.29 | 6.84 | 6.84 | 6.84 | 6.84 | 6.84 |
| Accounts Payable | 235.2 | 385.0 | 541.9 | 517.4 | 392.6 | 484.5 | 526.6 | 572.4 | 622.2 | 676.3 |
| Accounts Payable, % | 11.7 | 14.76 | 20.61 | 30.78 | 16.65 | 18.9 | 18.9 | 18.9 | 18.9 | 18.9 |
| Capital Expenditure | -170.7 | -176.7 | -249.7 | -241.7 | -194.8 | -243.1 | -264.2 | -287.2 | -312.2 | -339.3 |
| Capital Expenditure, % | -8.49 | -6.77 | -9.5 | -14.38 | -8.26 | -9.48 | -9.48 | -9.48 | -9.48 | -9.48 |
| Tax Rate, % | 2.56 | 2.56 | 2.56 | 2.56 | 2.56 | 2.56 | 2.56 | 2.56 | 2.56 | 2.56 |
| EBITAT | 303.1 | 348.0 | 34.8 | -969.9 | -340.1 | -215.5 | -234.2 | -254.6 | -276.7 | -300.8 |
| Depreciation | ||||||||||
| Changes in Account Receivables | ||||||||||
| Changes in Inventories | ||||||||||
| Changes in Accounts Payable | ||||||||||
| Capital Expenditure | ||||||||||
| UFCF | -883.4 | 6.4 | -203.1 | -474.5 | -515.9 | -400.2 | -387.1 | -420.8 | -457.4 | -497.2 |
| WACC, % | 5.79 | 5.79 | 5.82 | 5.8 | 5.81 | 5.8 | 5.8 | 5.8 | 5.8 | 5.8 |
| PV UFCF | ||||||||||
| SUM PV UFCF | -1,819.2 | |||||||||
| Long Term Growth Rate, % | 4.00 | |||||||||
| Free cash flow (T + 1) | -517 | |||||||||
| Terminal Value | -28,659 | |||||||||
| Present Terminal Value | -21,615 | |||||||||
| Enterprise Value | -23,434 | |||||||||
| Net Debt | 151 | |||||||||
| Equity Value | -23,585 | |||||||||
| Diluted Shares Outstanding, MM | 799 | |||||||||
| Equity Value Per Share | -29.51 |
Benefits of Choosing NSFOCUS Technologies Group Co., Ltd. (300369SZ)
- Comprehensive Financial Model: Utilize NSFOCUS's actual performance data for accurate DCF valuation.
- Full Control Over Forecasts: Modify revenue growth rates, profit margins, WACC, and other critical parameters.
- Real-Time Calculations: Instant updates allow you to view results as you adjust your inputs.
- Professional-Grade Template: A polished Excel file crafted for high-quality valuation processes.
- Flexible and Reusable: Designed for versatility, enabling ongoing use for in-depth financial projections.
Key Features
- Comprehensive NSFOCUS Data: Pre-filled with historical financials and future projections for NSFOCUS Technologies Group Co., Ltd. (300369SZ).
- Fully Customizable Parameters: Adjust growth rates, profit margins, discount rates, tax considerations, and capital investments.
- Interactive Valuation Tool: Automatically recalculates Net Present Value (NPV) and intrinsic value based on your specified inputs.
- Scenario Analysis: Develop various forecasting scenarios to explore different valuation results.
- Intuitive Interface: Designed to be straightforward and accessible for both seasoned professionals and newcomers.
How It Works
- Step 1: Download the Excel file for NSFOCUS Technologies Group Co., Ltd. (300369SZ).
- Step 2: Review the pre-filled financial data and forecasts provided for NSFOCUS.
- Step 3: Adjust key inputs such as revenue growth, WACC, and tax rates (highlighted cells).
- Step 4: Observe the DCF model refresh in real-time as you modify your assumptions.
- Step 5: Evaluate the outputs and leverage the results for your investment strategies.
Why Choose NSFOCUS Technologies Group Co., Ltd. ([300369SZ])?
- Time Efficient: Get started quickly with pre-built models tailored for your needs.
- Enhanced Precision: Access reliable data and formulas that minimize valuation errors.
- Completely Customizable: Adjust the model to fit your specific assumptions and forecasts.
- User-Friendly: Intuitive charts and outputs facilitate straightforward analysis of results.
- Preferred by Professionals: Built for experts who prioritize accuracy and ease of use.
Who Should Use This Product?
- Investors: Evaluate the intrinsic value of NSFOCUS Technologies Group Co., Ltd. (300369SZ) before making investment choices.
- CFOs: Utilize a high-quality DCF model for accurate financial reporting and analysis.
- Consultants: Easily modify the template for client valuation reports tailored to NSFOCUS Technologies.
- Entrepreneurs: Learn from the financial modeling techniques employed by established firms in the tech sector.
- Educators: Implement it as a teaching resource to showcase various valuation methodologies.
Contents of the Template
- In-Depth DCF Model: A customizable template featuring thorough valuation calculations.
- Industry-Specific Data: NSFOCUS Technologies Group Co., Ltd. (300369SZ) historical and forecasted financials included for evaluation.
- Adjustable Assumptions: Modify WACC, growth rates, and tax assumptions to explore different scenarios.
- Comprehensive Financial Statements: Detailed annual and quarterly reports for enhanced analysis.
- Essential Ratios: Integrated assessments for profitability, efficiency, and leverage metrics.
- Interactive Dashboard: Visual representations including charts and tables for straightforward, actionable insights.
Disclaimer
All information, articles, and product details provided on this website are for general informational and educational purposes only. We do not claim any ownership over, nor do we intend to infringe upon, any trademarks, copyrights, logos, brand names, or other intellectual property mentioned or depicted on this site. Such intellectual property remains the property of its respective owners, and any references here are made solely for identification or informational purposes, without implying any affiliation, endorsement, or partnership.
We make no representations or warranties, express or implied, regarding the accuracy, completeness, or suitability of any content or products presented. Nothing on this website should be construed as legal, tax, investment, financial, medical, or other professional advice. In addition, no part of this site—including articles or product references—constitutes a solicitation, recommendation, endorsement, advertisement, or offer to buy or sell any securities, franchises, or other financial instruments, particularly in jurisdictions where such activity would be unlawful.
All content is of a general nature and may not address the specific circumstances of any individual or entity. It is not a substitute for professional advice or services. Any actions you take based on the information provided here are strictly at your own risk. You accept full responsibility for any decisions or outcomes arising from your use of this website and agree to release us from any liability in connection with your use of, or reliance upon, the content or products found herein.