
|
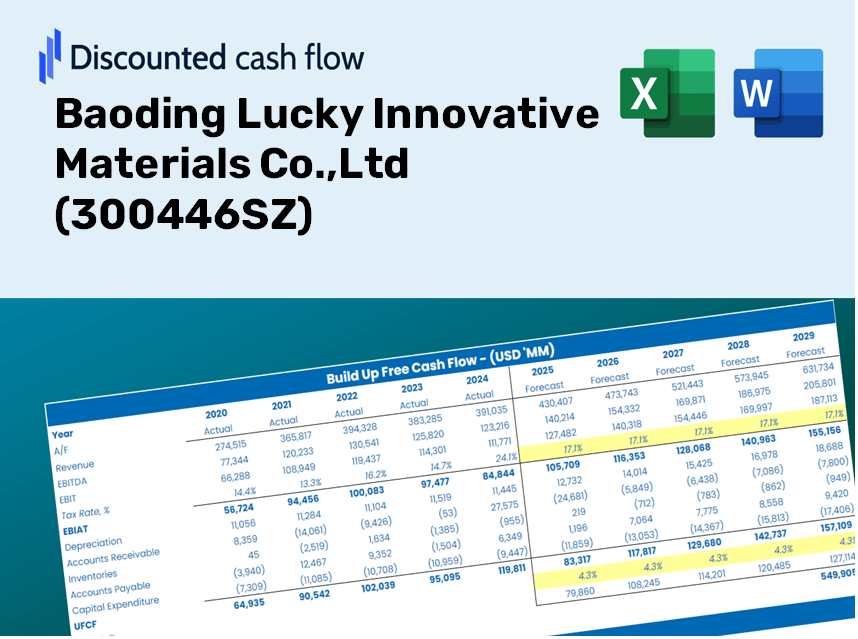
Baoding Lucky Innovative Materials Co.,Ltd (300446.SZ) DCF Valuation |
Fully Editable: Tailor To Your Needs In Excel Or Sheets
Professional Design: Trusted, Industry-Standard Templates
Investor-Approved Valuation Models
MAC/PC Compatible, Fully Unlocked
No Expertise Is Needed; Easy To Follow
Baoding Lucky Innovative Materials Co.,Ltd (300446.SZ) Bundle
Evaluate Baoding Lucky Innovative Materials Co., Ltd's financial prospects like an expert! This (300446SZ) DCF Calculator provides pre-filled financials along with the complete flexibility to modify revenue growth, WACC, margins, and other essential assumptions to align with your predictions.
What You Will Receive
- Accurate 300446SZ Financial Data: Pre-populated with Baoding Lucky Innovative Materials' historical and forecasted information for detailed analysis.
- Completely Customizable Template: Easily adjust key variables such as revenue growth, WACC, and EBITDA margin.
- Instantaneous Calculations: View updates to Baoding Lucky Innovative Materials' intrinsic value in real-time as you make modifications.
- Dedicated Valuation Tool: Tailored for investors, analysts, and consultants aiming for precise DCF outcomes.
- User-Centric Design: Intuitive layout with straightforward instructions suitable for all skill levels.
Key Features
- Advanced DCF Calculator: Features comprehensive unlevered and levered DCF valuation models tailored for Baoding Lucky Innovative Materials Co., Ltd (300446SZ).
- WACC Calculator: Ready-to-use Weighted Average Cost of Capital sheet with adjustable inputs for enhanced accuracy.
- Customizable Forecast Assumptions: Adjust growth rates, capital expenditures, and discount rates to fit your analysis needs.
- Integrated Financial Ratios: Evaluate profitability, leverage, and efficiency ratios specific to Baoding Lucky Innovative Materials Co., Ltd (300446SZ).
- Dashboard and Visual Charts: Generate visual summaries of crucial valuation metrics for straightforward interpretation.
How It Works
- 1. Access the Template: Download and open the Excel file featuring Baoding Lucky Innovative Materials Co., Ltd’s preloaded data.
- 2. Modify Assumptions: Adjust key variables such as growth rates, WACC, and capital expenditures to fit your analysis.
- 3. Analyze Results in Real Time: The DCF model automatically computes intrinsic value and NPV as you make changes.
- 4. Explore Various Scenarios: Evaluate different forecasts to understand a range of valuation possibilities.
- 5. Present with Assurance: Share professional valuation insights to bolster your decision-making process.
Why Choose This Calculator for Baoding Lucky Innovative Materials Co., Ltd (300446SZ)?
- Precise Data: Leverage accurate financial metrics from Baoding Lucky for dependable valuation outcomes.
- Customizable Features: Tailor essential variables such as growth rates, WACC, and tax rates to align with your forecasts.
- Efficient: Pre-configured calculations save you the hassle of building from the ground up.
- Professional Tool: Crafted for the needs of investors, analysts, and consultants alike.
- User-Friendly Interface: Designed with an intuitive layout and clear instructions for a seamless experience for all users.
Who Can Benefit from This Product?
- Finance Students: Explore valuation methodologies and practice with actual market data pertaining to Baoding Lucky Innovative Materials Co., Ltd (300446SZ).
- Academics: Integrate advanced financial models into your teaching or research efforts.
- Investors: Validate your investment strategies and examine valuation results for Baoding Lucky Innovative Materials Co., Ltd (300446SZ).
- Analysts: Optimize your analysis process using a customizable, ready-made DCF model.
- Small Business Owners: Understand the analytical approaches used for assessing large public companies like Baoding Lucky Innovative Materials Co., Ltd (300446SZ).
Contents of the Template
- Pre-Filled DCF Model: Baoding Lucky Innovative Materials' financial data preloaded for immediate analysis.
- WACC Calculator: Comprehensive calculations for Weighted Average Cost of Capital.
- Financial Ratios: Assess Baoding Lucky's profitability, leverage, and operational efficiency.
- Editable Inputs: Modify assumptions such as growth rates, margins, and capital expenditures to suit your analysis.
- Financial Statements: Access annual and quarterly reports to facilitate in-depth evaluation.
- Interactive Dashboard: Easily visualize essential valuation metrics and outcomes.
Disclaimer
All information, articles, and product details provided on this website are for general informational and educational purposes only. We do not claim any ownership over, nor do we intend to infringe upon, any trademarks, copyrights, logos, brand names, or other intellectual property mentioned or depicted on this site. Such intellectual property remains the property of its respective owners, and any references here are made solely for identification or informational purposes, without implying any affiliation, endorsement, or partnership.
We make no representations or warranties, express or implied, regarding the accuracy, completeness, or suitability of any content or products presented. Nothing on this website should be construed as legal, tax, investment, financial, medical, or other professional advice. In addition, no part of this site—including articles or product references—constitutes a solicitation, recommendation, endorsement, advertisement, or offer to buy or sell any securities, franchises, or other financial instruments, particularly in jurisdictions where such activity would be unlawful.
All content is of a general nature and may not address the specific circumstances of any individual or entity. It is not a substitute for professional advice or services. Any actions you take based on the information provided here are strictly at your own risk. You accept full responsibility for any decisions or outcomes arising from your use of this website and agree to release us from any liability in connection with your use of, or reliance upon, the content or products found herein.