
|
Maccura Biotechnology Co.Ltd (300463.SZ) DCF Valuation |
Fully Editable: Tailor To Your Needs In Excel Or Sheets
Professional Design: Trusted, Industry-Standard Templates
Investor-Approved Valuation Models
MAC/PC Compatible, Fully Unlocked
No Expertise Is Needed; Easy To Follow
Maccura Biotechnology Co.Ltd (300463.SZ) Bundle
Looking to determine the intrinsic value of Maccura Biotechnology Co., Ltd? Our (300463SZ) DCF Calculator integrates real-world data with comprehensive customization features, allowing you to adjust forecasts and enhance your investment strategies.
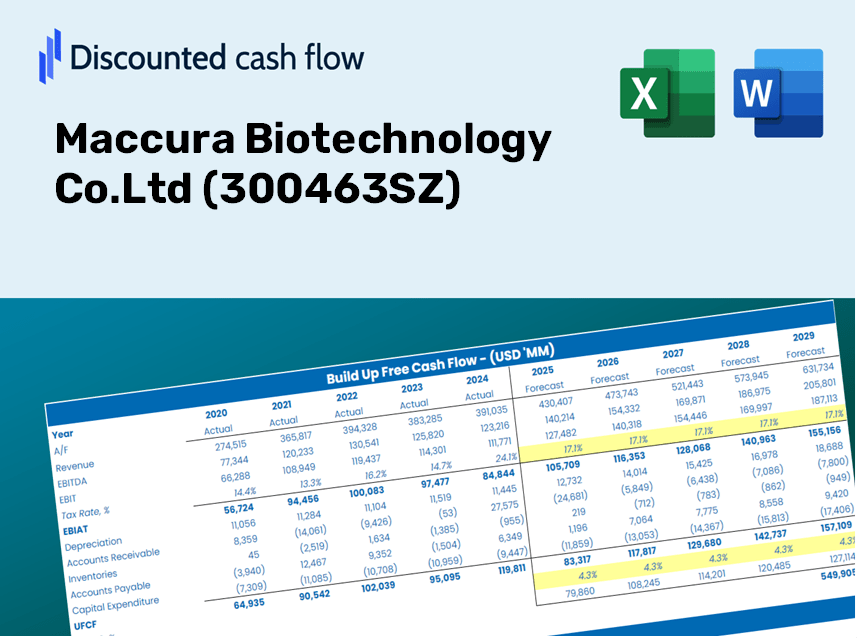
Discounted Cash Flow (DCF) - (USD MM)
| Year | AY1 2020 |
AY2 2021 |
AY3 2022 |
AY4 2023 |
AY5 2024 |
FY1 2025 |
FY2 2026 |
FY3 2027 |
FY4 2028 |
FY5 2029 |
|---|---|---|---|---|---|---|---|---|---|---|
| Revenue | 3,703.9 | 3,980.6 | 3,608.4 | 2,895.8 | 2,548.8 | 2,334.6 | 2,138.4 | 1,958.7 | 1,794.1 | 1,643.4 |
| Revenue Growth, % | 0 | 7.47 | -9.35 | -19.75 | -11.98 | -8.4 | -8.4 | -8.4 | -8.4 | -8.4 |
| EBITDA | 1,243.2 | 1,482.6 | 1,098.8 | 652.0 | 483.4 | 666.5 | 610.5 | 559.2 | 512.2 | 469.1 |
| EBITDA, % | 33.56 | 37.25 | 30.45 | 22.52 | 18.96 | 28.55 | 28.55 | 28.55 | 28.55 | 28.55 |
| Depreciation | 208.7 | 239.4 | 274.4 | 313.1 | 336.6 | 202.0 | 185.1 | 169.5 | 155.3 | 142.2 |
| Depreciation, % | 5.64 | 6.01 | 7.6 | 10.81 | 13.21 | 8.65 | 8.65 | 8.65 | 8.65 | 8.65 |
| EBIT | 1,034.4 | 1,243.2 | 824.4 | 338.9 | 146.8 | 464.4 | 425.4 | 389.7 | 356.9 | 326.9 |
| EBIT, % | 27.93 | 31.23 | 22.85 | 11.7 | 5.76 | 19.89 | 19.89 | 19.89 | 19.89 | 19.89 |
| Total Cash | 612.1 | 637.2 | 1,251.1 | 1,147.1 | 731.5 | 632.7 | 579.6 | 530.9 | 486.3 | 445.4 |
| Total Cash, percent | .0 | .0 | .0 | .0 | .0 | .0 | .0 | .0 | .0 | .0 |
| Account Receivables | 2,102.6 | 1,945.7 | 2,155.1 | 1,861.3 | 1,612.7 | 1,367.7 | 1,252.8 | 1,147.5 | 1,051.1 | 962.8 |
| Account Receivables, % | 56.77 | 48.88 | 59.73 | 64.28 | 63.27 | 58.58 | 58.58 | 58.58 | 58.58 | 58.58 |
| Inventories | 1,074.8 | 1,076.4 | 1,039.5 | 907.5 | 901.6 | 707.8 | 648.3 | 593.8 | 543.9 | 498.2 |
| Inventories, % | 29.02 | 27.04 | 28.81 | 31.34 | 35.37 | 30.32 | 30.32 | 30.32 | 30.32 | 30.32 |
| Accounts Payable | 402.1 | 317.4 | 380.9 | 365.8 | 316.7 | 254.2 | 232.9 | 213.3 | 195.4 | 179.0 |
| Accounts Payable, % | 10.85 | 7.97 | 10.56 | 12.63 | 12.43 | 10.89 | 10.89 | 10.89 | 10.89 | 10.89 |
| Capital Expenditure | -501.3 | -601.8 | -987.7 | -877.9 | -963.0 | -579.6 | -530.9 | -486.3 | -445.4 | -408.0 |
| Capital Expenditure, % | -13.53 | -15.12 | -27.37 | -30.32 | -37.78 | -24.83 | -24.83 | -24.83 | -24.83 | -24.83 |
| Tax Rate, % | -1.73 | -1.73 | -1.73 | -1.73 | -1.73 | -1.73 | -1.73 | -1.73 | -1.73 | -1.73 |
| EBITAT | 846.9 | 1,001.8 | 739.8 | 346.9 | 149.3 | 420.0 | 384.7 | 352.4 | 322.8 | 295.7 |
| Depreciation | ||||||||||
| Changes in Account Receivables | ||||||||||
| Changes in Inventories | ||||||||||
| Changes in Accounts Payable | ||||||||||
| Capital Expenditure | ||||||||||
| UFCF | -2,221.1 | 710.1 | -82.5 | 192.9 | -271.7 | 418.8 | 192.0 | 175.8 | 161.1 | 147.5 |
| WACC, % | 4.7 | 4.69 | 4.72 | 4.75 | 4.75 | 4.72 | 4.72 | 4.72 | 4.72 | 4.72 |
| PV UFCF | ||||||||||
| SUM PV UFCF | 979.1 | |||||||||
| Long Term Growth Rate, % | 2.00 | |||||||||
| Free cash flow (T + 1) | 150 | |||||||||
| Terminal Value | 5,528 | |||||||||
| Present Terminal Value | 4,389 | |||||||||
| Enterprise Value | 5,368 | |||||||||
| Net Debt | -225 | |||||||||
| Equity Value | 5,593 | |||||||||
| Diluted Shares Outstanding, MM | 613 | |||||||||
| Equity Value Per Share | 9.13 |
What You Will Receive
- Adjustable Forecast Parameters: Easily modify assumptions (growth %, margins, WACC) to generate various scenarios.
- Real-Time Data: Maccura Biotechnology Co., Ltd’s financial information is pre-filled to facilitate your analysis.
- Automated DCF Outputs: The template computes Net Present Value (NPV) and intrinsic value automatically.
- Customizable and Professional Design: A sophisticated Excel model tailored to fit your valuation requirements.
- Designed for Analysts and Investors: Perfect for evaluating projections, confirming strategies, and enhancing efficiency.
Key Features
- 🔍 Real-Life Maccura Financials: Pre-filled historical and projected data for Maccura Biotechnology Co. Ltd (300463SZ).
- ✏️ Fully Customizable Inputs: Adjust all critical parameters (yellow cells) such as WACC, growth %, and tax rates.
- 📊 Professional DCF Valuation: Integrated formulas calculate Maccura’s intrinsic value using the Discounted Cash Flow approach.
- ⚡ Instant Results: Visualize Maccura’s valuation immediately after making adjustments.
- Scenario Analysis: Evaluate and compare outcomes for different financial assumptions side-by-side.
How It Works
- Step 1: Download the comprehensive Excel template featuring data for Maccura Biotechnology Co. Ltd (300463SZ).
- Step 2: Review the pre-populated sheets to gain insights into key performance indicators.
- Step 3: Modify forecasts and assumptions in the editable yellow cells (WACC, growth, margins).
- Step 4: Instantly access updated calculations, including the intrinsic value of Maccura Biotechnology Co. Ltd (300463SZ).
- Step 5: Use the outputs to make informed investment choices or create detailed reports.
Why Opt for This Calculator?
- Reliable Data: Utilizes authentic Maccura Biotechnology Co. Ltd financials for trustworthy valuation outcomes.
- Customizable Features: Modify essential variables such as growth rates, WACC, and tax rates to align with your forecasts.
- Efficiency: Ready-to-use calculations save you the hassle of starting from the ground up.
- Professional Quality: Tailored for investors, analysts, and consultants in the biotech sector.
- Easy to Use: User-friendly design and clear instructions ensure accessibility for everyone.
Who Can Benefit from Maccura Biotechnology Co.Ltd (300463SZ)?
- Investors: Utilize a sophisticated valuation tool to make informed investment choices.
- Financial Analysts: Efficiently leverage a pre-configured DCF model that can be tailored to your needs.
- Consultants: Rapidly adjust the template for impactful client reports or presentations.
- Biotechnology Enthusiasts: Enhance your knowledge of valuation methods through practical, real-world examples.
- Educators and Students: Employ this resource as a hands-on learning aid in biotechnology and finance courses.
Contents of the Template
- Pre-Filled Data: Contains historical financial data and forecasts for Maccura Biotechnology Co., Ltd (300463SZ).
- Discounted Cash Flow Model: An editable DCF valuation model with automatic calculation features.
- Weighted Average Cost of Capital (WACC): A specific sheet for WACC calculations based on user-defined inputs.
- Key Financial Ratios: Evaluate Maccura’s profitability, operational efficiency, and financial leverage.
- Customizable Inputs: Easily modify parameters such as revenue growth, profit margins, and tax rates.
- Clear Dashboard: Visual representations including charts and tables that highlight key valuation results.
Disclaimer
All information, articles, and product details provided on this website are for general informational and educational purposes only. We do not claim any ownership over, nor do we intend to infringe upon, any trademarks, copyrights, logos, brand names, or other intellectual property mentioned or depicted on this site. Such intellectual property remains the property of its respective owners, and any references here are made solely for identification or informational purposes, without implying any affiliation, endorsement, or partnership.
We make no representations or warranties, express or implied, regarding the accuracy, completeness, or suitability of any content or products presented. Nothing on this website should be construed as legal, tax, investment, financial, medical, or other professional advice. In addition, no part of this site—including articles or product references—constitutes a solicitation, recommendation, endorsement, advertisement, or offer to buy or sell any securities, franchises, or other financial instruments, particularly in jurisdictions where such activity would be unlawful.
All content is of a general nature and may not address the specific circumstances of any individual or entity. It is not a substitute for professional advice or services. Any actions you take based on the information provided here are strictly at your own risk. You accept full responsibility for any decisions or outcomes arising from your use of this website and agree to release us from any liability in connection with your use of, or reliance upon, the content or products found herein.