
|
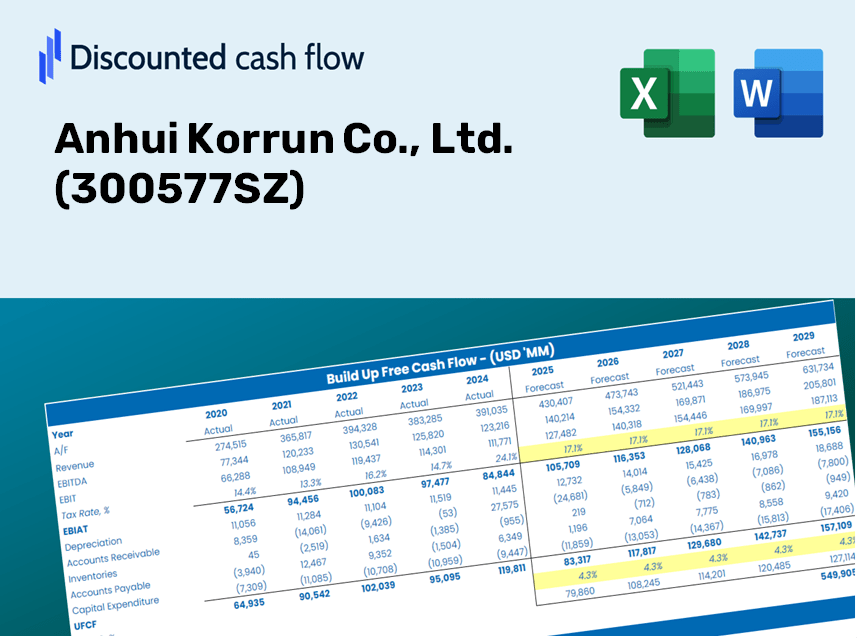
Anhui Korrun Co., Ltd. (300577.SZ) DCF Valuation |
Fully Editable: Tailor To Your Needs In Excel Or Sheets
Professional Design: Trusted, Industry-Standard Templates
Investor-Approved Valuation Models
MAC/PC Compatible, Fully Unlocked
No Expertise Is Needed; Easy To Follow
Anhui Korrun Co., Ltd. (300577.SZ) Bundle
Master your Anhui Korrun Co., Ltd. (300577SZ) valuation analysis using our sophisticated DCF Calculator! This Excel template, preloaded with real (300577SZ) data, enables you to adjust forecasts and assumptions for an accurate calculation of Anhui Korrun's intrinsic value.
Your Benefits
- Adjustable Forecast Parameters: Seamlessly modify key inputs (growth %, margins, WACC) to explore various scenarios.
- Industry Data at Your Fingertips: Access pre-filled financial metrics from Anhui Korrun Co., Ltd. (300577SZ) to enhance your analysis.
- Automated DCF Calculations: The template computes Net Present Value (NPV) and intrinsic value automatically.
- Tailored and Professional Design: A refined Excel model that caters to your valuation requirements.
- Designed for Analysts and Investors: Perfect for examining forecasts, verifying strategies, and optimizing efficiency.
Key Features
- Authentic Financial Data: Gain access to precise historical information and future forecasts for Anhui Korrun Co., Ltd. (300577SZ).
- Adjustable Forecast Parameters: Modify the highlighted fields for WACC, growth rates, and profit margins as needed.
- Real-Time Calculations: Enjoy automatic updates to DCF, Net Present Value (NPV), and cash flow assessments.
- User-Friendly Dashboard: Intuitive charts and summaries to help you easily interpret your valuation findings.
- Suitable for All Skill Levels: Designed for a diverse audience, including investors, CFOs, and consultants.
How It Operates
- 1. Access the Template: Download and open the Excel file featuring Anhui Korrun Co., Ltd. (300577SZ) preloaded data.
- 2. Modify Assumptions: Adjust essential inputs such as growth rates, WACC, and capital expenditures.
- 3. Instant Result Generation: The DCF model automatically calculates intrinsic value and NPV.
- 4. Experiment with Scenarios: Evaluate various forecasts to assess different valuation results.
- 5. Present with Assurance: Deliver professional valuation insights to back up your decisions.
Why Choose This Calculator for Anhui Korrun Co., Ltd. (300577SZ)?
- Designed for Industry Experts: A sophisticated tool tailored for analysts, financial officers, and consultants.
- Accurate Financial Data: Historical and projected financial information for Anhui Korrun Co., Ltd. preloaded for reliability.
- Flexible Scenario Analysis: Effortlessly simulate various forecasts and assumptions.
- Transparent Results: Automatically computes intrinsic value, NPV, and essential metrics.
- User-Friendly: Comprehensive step-by-step guidance to navigate the process smoothly.
Who Can Benefit from Anhui Korrun Co., Ltd. (300577SZ)?
- Investors: Make informed investment choices with our advanced valuation tools.
- Financial Analysts: Streamline your workflow with our customizable DCF model.
- Consultants: Effortlessly modify templates for client presentations and reports.
- Finance Enthusiasts: Enhance your knowledge of valuation strategies through practical examples.
- Educators and Students: Utilize our resources as a hands-on learning aid in finance courses.
Contents of the Template
- Pre-Filled DCF Model: Anhui Korrun Co., Ltd.'s (300577SZ) financial data preloaded for immediate analysis.
- WACC Calculator: Comprehensive calculations for Weighted Average Cost of Capital.
- Financial Ratios: Assess Anhui Korrun Co., Ltd.'s (300577SZ) profitability, leverage, and operational efficiency.
- Editable Inputs: Modify assumptions like growth rates, margins, and CAPEX to tailor your scenarios.
- Financial Statements: Access annual and quarterly reports to aid in thorough analysis.
- Interactive Dashboard: Seamlessly visualize essential valuation metrics and outcomes.
Disclaimer
All information, articles, and product details provided on this website are for general informational and educational purposes only. We do not claim any ownership over, nor do we intend to infringe upon, any trademarks, copyrights, logos, brand names, or other intellectual property mentioned or depicted on this site. Such intellectual property remains the property of its respective owners, and any references here are made solely for identification or informational purposes, without implying any affiliation, endorsement, or partnership.
We make no representations or warranties, express or implied, regarding the accuracy, completeness, or suitability of any content or products presented. Nothing on this website should be construed as legal, tax, investment, financial, medical, or other professional advice. In addition, no part of this site—including articles or product references—constitutes a solicitation, recommendation, endorsement, advertisement, or offer to buy or sell any securities, franchises, or other financial instruments, particularly in jurisdictions where such activity would be unlawful.
All content is of a general nature and may not address the specific circumstances of any individual or entity. It is not a substitute for professional advice or services. Any actions you take based on the information provided here are strictly at your own risk. You accept full responsibility for any decisions or outcomes arising from your use of this website and agree to release us from any liability in connection with your use of, or reliance upon, the content or products found herein.