
|
Yealink Network Technology Co., Ltd. (300628.SZ) DCF Valuation |
Fully Editable: Tailor To Your Needs In Excel Or Sheets
Professional Design: Trusted, Industry-Standard Templates
Investor-Approved Valuation Models
MAC/PC Compatible, Fully Unlocked
No Expertise Is Needed; Easy To Follow
Yealink Network Technology Co., Ltd. (300628.SZ) Bundle
Enhance your investment choices with the [Symbol] DCF Calculator! Utilize accurate Yealink financial data, adjust growth predictions and expenses, and instantly observe how these modifications affect [Company] intrinsic value.
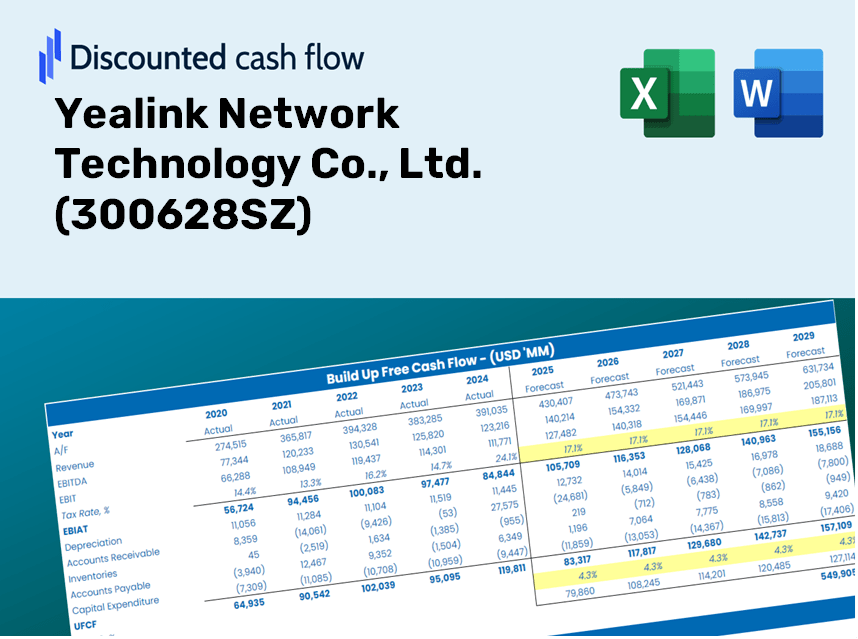
Discounted Cash Flow (DCF) - (USD MM)
| Year | AY1 2020 |
AY2 2021 |
AY3 2022 |
AY4 2023 |
AY5 2024 |
FY1 2025 |
FY2 2026 |
FY3 2027 |
FY4 2028 |
FY5 2029 |
|---|---|---|---|---|---|---|---|---|---|---|
| Revenue | 2,754.3 | 3,684.2 | 4,810.6 | 4,348.0 | 5,621.3 | 6,147.7 | 6,723.4 | 7,353.0 | 8,041.6 | 8,794.7 |
| Revenue Growth, % | 0 | 33.76 | 30.57 | -9.61 | 29.28 | 9.36 | 9.36 | 9.36 | 9.36 | 9.36 |
| EBITDA | 1,295.5 | 1,604.1 | 2,168.9 | 1,962.3 | 2,672.2 | 2,807.4 | 3,070.3 | 3,357.8 | 3,672.2 | 4,016.1 |
| EBITDA, % | 47.03 | 43.54 | 45.09 | 45.13 | 47.54 | 45.67 | 45.67 | 45.67 | 45.67 | 45.67 |
| Depreciation | 28.4 | 33.8 | 55.6 | 63.8 | 76.6 | 72.9 | 79.8 | 87.2 | 95.4 | 104.3 |
| Depreciation, % | 1.03 | 0.91691 | 1.16 | 1.47 | 1.36 | 1.19 | 1.19 | 1.19 | 1.19 | 1.19 |
| EBIT | 1,267.1 | 1,570.3 | 2,113.3 | 1,898.5 | 2,595.6 | 2,734.5 | 2,990.5 | 3,270.6 | 3,576.8 | 3,911.8 |
| EBIT, % | 46 | 42.62 | 43.93 | 43.66 | 46.17 | 44.48 | 44.48 | 44.48 | 44.48 | 44.48 |
| Total Cash | 4,281.6 | 4,643.1 | 5,535.8 | 5,466.4 | 6,208.0 | 6,147.7 | 6,723.4 | 7,353.0 | 8,041.6 | 8,794.7 |
| Total Cash, percent | .0 | .0 | .0 | .0 | .0 | .0 | .0 | .0 | .0 | .0 |
| Account Receivables | 512.8 | 683.6 | 834.0 | 824.2 | 931.5 | 1,107.1 | 1,210.7 | 1,324.1 | 1,448.1 | 1,583.7 |
| Account Receivables, % | 18.62 | 18.55 | 17.34 | 18.96 | 16.57 | 18.01 | 18.01 | 18.01 | 18.01 | 18.01 |
| Inventories | 345.4 | 729.9 | 563.7 | 726.7 | 813.2 | 925.2 | 1,011.9 | 1,106.6 | 1,210.2 | 1,323.6 |
| Inventories, % | 12.54 | 19.81 | 11.72 | 16.71 | 14.47 | 15.05 | 15.05 | 15.05 | 15.05 | 15.05 |
| Accounts Payable | 281.8 | 439.0 | 430.8 | 519.2 | 469.7 | 632.0 | 691.2 | 755.9 | 826.7 | 904.1 |
| Accounts Payable, % | 10.23 | 11.92 | 8.96 | 11.94 | 8.36 | 10.28 | 10.28 | 10.28 | 10.28 | 10.28 |
| Capital Expenditure | -148.4 | -296.6 | -657.9 | -188.2 | -140.1 | -417.3 | -456.3 | -499.1 | -545.8 | -596.9 |
| Capital Expenditure, % | -5.39 | -8.05 | -13.68 | -4.33 | -2.49 | -6.79 | -6.79 | -6.79 | -6.79 | -6.79 |
| Tax Rate, % | 8.54 | 8.54 | 8.54 | 8.54 | 8.54 | 8.54 | 8.54 | 8.54 | 8.54 | 8.54 |
| EBITAT | 1,155.3 | 1,434.4 | 1,937.2 | 1,750.4 | 2,373.9 | 2,504.0 | 2,738.4 | 2,994.9 | 3,275.3 | 3,582.0 |
| Depreciation | ||||||||||
| Changes in Account Receivables | ||||||||||
| Changes in Inventories | ||||||||||
| Changes in Accounts Payable | ||||||||||
| Capital Expenditure | ||||||||||
| UFCF | 458.8 | 773.6 | 1,342.5 | 1,561.2 | 2,067.1 | 2,034.3 | 2,230.7 | 2,439.6 | 2,668.1 | 2,917.9 |
| WACC, % | 5.86 | 5.86 | 5.86 | 5.86 | 5.86 | 5.86 | 5.86 | 5.86 | 5.86 | 5.86 |
| PV UFCF | ||||||||||
| SUM PV UFCF | 10,287.1 | |||||||||
| Long Term Growth Rate, % | 3.00 | |||||||||
| Free cash flow (T + 1) | 3,005 | |||||||||
| Terminal Value | 104,940 | |||||||||
| Present Terminal Value | 78,922 | |||||||||
| Enterprise Value | 89,209 | |||||||||
| Net Debt | -495 | |||||||||
| Equity Value | 89,704 | |||||||||
| Diluted Shares Outstanding, MM | 1,265 | |||||||||
| Equity Value Per Share | 70.90 |
What You Will Receive
- Pre-Loaded Financial Model: Yealink's actual performance data supports accurate DCF valuation.
- Comprehensive Forecast Control: Modify revenue growth rates, profit margins, WACC, and other essential factors.
- Real-Time Calculations: Automatic updates provide immediate feedback as you adjust inputs.
- Professional-Grade Template: A polished Excel file crafted for high-quality valuation work.
- Flexible and Reusable: Designed for adaptability, enabling consistent use for in-depth forecasts.
Key Features
- Customizable Forecast Inputs: Adjust vital parameters such as revenue growth, EBITDA %, and capital expenditures for tailored analysis.
- Instant DCF Valuation: Automatically computes intrinsic value, NPV, and other essential metrics at the click of a button.
- High-Precision Accuracy: Leveraging Yealink's real-world financial data to deliver reliable valuation results.
- Effortless Scenario Analysis: Easily evaluate various assumptions and assess different outcomes side by side.
- Time-Efficient Solution: Streamline your workflow by avoiding the need to create intricate valuation models from scratch.
How It Functions
- 1. Access the Template: Download and open the Excel file featuring Yealink Network Technology Co., Ltd.'s preloaded data.
- 2. Adjust Assumptions: Modify essential inputs such as growth rates, WACC, and capital expenditures.
- 3. View Instant Results: The DCF model automatically computes intrinsic value and NPV in real-time.
- 4. Explore Different Scenarios: Analyze various forecasts to evaluate alternative valuation results.
- 5. Present with Assurance: Deliver professional valuation insights to inform your strategies.
Why Opt for This Calculator?
- Precise Information: Accurate Yealink financial data ensures trustworthy valuation outcomes.
- Tailorable: Modify crucial factors like growth projections, WACC, and tax rates to fit your forecasts.
- Efficient: Built-in calculations save you the hassle of starting from the ground up.
- Professional-Quality Tool: Crafted for investors, analysts, and consultants in the field.
- Easy to Use: A straightforward design and clear, step-by-step guidance make it accessible for all users.
Who Should Utilize This Product?
- Investors: Effectively assess Yealink's fair value before making investment choices.
- CFOs: Utilize a high-quality DCF model for financial reporting and analytical purposes.
- Consultants: Seamlessly customize the template for valuation reports tailored to clients.
- Entrepreneurs: Acquire knowledge about financial modeling practices utilized by leading firms.
- Educators: Employ it as an educational resource to illustrate valuation techniques.
Contents of the Template
- Operating and Balance Sheet Data: Pre-filled historical data and forecasts for Yealink Network Technology Co., Ltd. (300628SZ), encompassing revenue, EBITDA, EBIT, and capital expenditures.
- WACC Calculation: A dedicated sheet for the Weighted Average Cost of Capital (WACC), featuring parameters such as Beta, risk-free rate, and share price.
- DCF Valuation (Unlevered and Levered): Customizable Discounted Cash Flow models that illustrate intrinsic value with comprehensive calculations.
- Financial Statements: Pre-loaded annual and quarterly financial statements for Yealink to facilitate analysis.
- Key Ratios: A set of profitability, leverage, and efficiency ratios specific to Yealink Network Technology Co., Ltd. (300628SZ).
- Dashboard and Charts: A visual summary of valuation outputs and assumptions, making it easy to analyze results.
Disclaimer
All information, articles, and product details provided on this website are for general informational and educational purposes only. We do not claim any ownership over, nor do we intend to infringe upon, any trademarks, copyrights, logos, brand names, or other intellectual property mentioned or depicted on this site. Such intellectual property remains the property of its respective owners, and any references here are made solely for identification or informational purposes, without implying any affiliation, endorsement, or partnership.
We make no representations or warranties, express or implied, regarding the accuracy, completeness, or suitability of any content or products presented. Nothing on this website should be construed as legal, tax, investment, financial, medical, or other professional advice. In addition, no part of this site—including articles or product references—constitutes a solicitation, recommendation, endorsement, advertisement, or offer to buy or sell any securities, franchises, or other financial instruments, particularly in jurisdictions where such activity would be unlawful.
All content is of a general nature and may not address the specific circumstances of any individual or entity. It is not a substitute for professional advice or services. Any actions you take based on the information provided here are strictly at your own risk. You accept full responsibility for any decisions or outcomes arising from your use of this website and agree to release us from any liability in connection with your use of, or reliance upon, the content or products found herein.