
|
Wuxi Longsheng Technology Co.,Ltd (300680.SZ) DCF Valuation |
Fully Editable: Tailor To Your Needs In Excel Or Sheets
Professional Design: Trusted, Industry-Standard Templates
Investor-Approved Valuation Models
MAC/PC Compatible, Fully Unlocked
No Expertise Is Needed; Easy To Follow
Wuxi Longsheng Technology Co.,Ltd (300680.SZ) Bundle
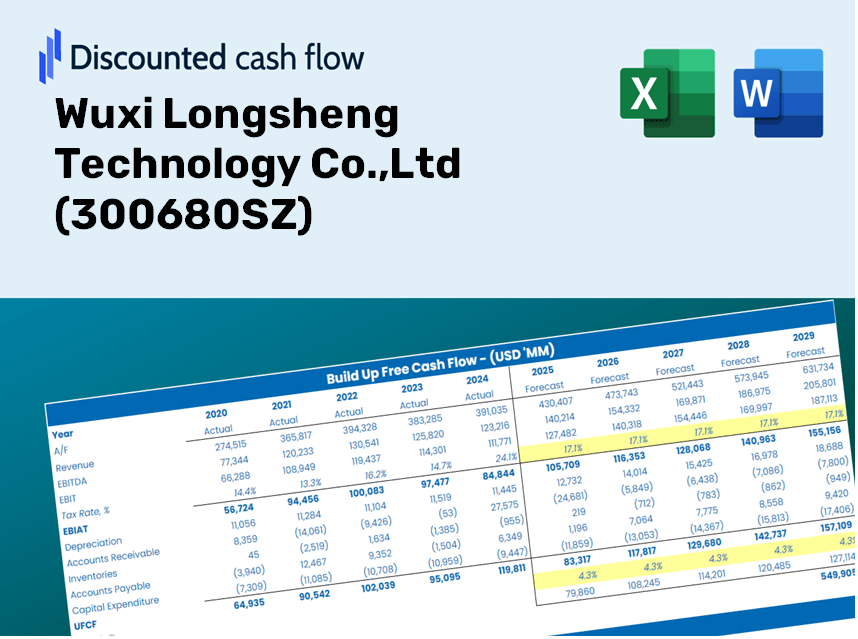
Gain insights into your Wuxi Longsheng Technology Co.,Ltd (300680SZ) valuation analysis using our state-of-the-art DCF Calculator! Loaded with real (300680SZ) data, this Excel template enables you to adjust forecasts and assumptions, allowing for precise calculations of Wuxi Longsheng Technology Co.,Ltd's intrinsic value.
Discounted Cash Flow (DCF) - (USD MM)
| Year | AY1 2020 |
AY2 2021 |
AY3 2022 |
AY4 2023 |
AY5 2024 |
FY1 2025 |
FY2 2026 |
FY3 2027 |
FY4 2028 |
FY5 2029 |
|---|---|---|---|---|---|---|---|---|---|---|
| Revenue | 578.1 | 929.7 | 1,148.3 | 1,827.0 | 2,397.3 | 3,444.2 | 4,948.1 | 7,108.8 | 10,213.0 | 14,672.6 |
| Revenue Growth, % | 0 | 60.83 | 23.51 | 59.11 | 31.21 | 43.67 | 43.67 | 43.67 | 43.67 | 43.67 |
| EBITDA | 101.1 | 143.1 | 131.4 | 213.8 | 330.4 | 480.9 | 690.8 | 992.5 | 1,425.9 | 2,048.6 |
| EBITDA, % | 17.49 | 15.4 | 11.45 | 11.7 | 13.78 | 13.96 | 13.96 | 13.96 | 13.96 | 13.96 |
| Depreciation | 31.5 | 39.7 | 50.6 | 71.9 | 94.4 | 151.5 | 217.6 | 312.7 | 449.2 | 645.4 |
| Depreciation, % | 5.44 | 4.27 | 4.41 | 3.93 | 3.94 | 4.4 | 4.4 | 4.4 | 4.4 | 4.4 |
| EBIT | 69.6 | 103.5 | 80.8 | 141.9 | 235.9 | 329.4 | 473.2 | 679.8 | 976.7 | 1,403.2 |
| EBIT, % | 12.04 | 11.13 | 7.04 | 7.77 | 9.84 | 9.56 | 9.56 | 9.56 | 9.56 | 9.56 |
| Total Cash | 207.3 | 119.4 | 646.9 | 734.1 | 674.3 | 1,194.1 | 1,715.5 | 2,464.6 | 3,540.8 | 5,087.0 |
| Total Cash, percent | .0 | .0 | .0 | .0 | .0 | .0 | .0 | .0 | .0 | .0 |
| Account Receivables | 293.8 | 395.6 | 534.9 | 807.8 | 944.1 | 1,539.9 | 2,212.3 | 3,178.3 | 4,566.2 | 6,560.1 |
| Account Receivables, % | 50.82 | 42.55 | 46.58 | 44.21 | 39.38 | 44.71 | 44.71 | 44.71 | 44.71 | 44.71 |
| Inventories | 153.4 | 240.6 | 313.0 | 381.6 | 463.1 | 825.7 | 1,186.3 | 1,704.3 | 2,448.4 | 3,517.6 |
| Inventories, % | 26.53 | 25.88 | 27.26 | 20.89 | 19.32 | 23.97 | 23.97 | 23.97 | 23.97 | 23.97 |
| Accounts Payable | 227.2 | 302.4 | 385.2 | 632.8 | 834.6 | 1,204.3 | 1,730.2 | 2,485.7 | 3,571.2 | 5,130.6 |
| Accounts Payable, % | 39.31 | 32.53 | 33.55 | 34.63 | 34.81 | 34.97 | 34.97 | 34.97 | 34.97 | 34.97 |
| Capital Expenditure | -115.4 | -205.6 | -452.9 | -180.8 | -328.3 | -724.1 | -1,040.3 | -1,494.6 | -2,147.2 | -3,084.8 |
| Capital Expenditure, % | -19.97 | -22.12 | -39.44 | -9.9 | -13.69 | -21.02 | -21.02 | -21.02 | -21.02 | -21.02 |
| Tax Rate, % | 13.07 | 13.07 | 13.07 | 13.07 | 13.07 | 13.07 | 13.07 | 13.07 | 13.07 | 13.07 |
| EBITAT | 60.9 | 92.0 | 84.7 | 126.0 | 205.1 | 297.8 | 427.9 | 614.7 | 883.2 | 1,268.8 |
| Depreciation | ||||||||||
| Changes in Account Receivables | ||||||||||
| Changes in Inventories | ||||||||||
| Changes in Accounts Payable | ||||||||||
| Capital Expenditure | ||||||||||
| UFCF | -243.0 | -187.8 | -446.6 | -76.9 | -44.8 | -863.4 | -901.8 | -1,295.6 | -1,861.4 | -2,674.2 |
| WACC, % | 5.54 | 5.55 | 5.58 | 5.55 | 5.54 | 5.55 | 5.55 | 5.55 | 5.55 | 5.55 |
| PV UFCF | ||||||||||
| SUM PV UFCF | -6,270.3 | |||||||||
| Long Term Growth Rate, % | 2.00 | |||||||||
| Free cash flow (T + 1) | -2,728 | |||||||||
| Terminal Value | -76,829 | |||||||||
| Present Terminal Value | -58,644 | |||||||||
| Enterprise Value | -64,915 | |||||||||
| Net Debt | 537 | |||||||||
| Equity Value | -65,452 | |||||||||
| Diluted Shares Outstanding, MM | 228 | |||||||||
| Equity Value Per Share | -286.74 |
What You Will Receive
- Authentic Wuxi Longsheng Data: Comprehensive financials – from revenue to EBIT – based on actual and forecasted figures.
- Complete Customization: Modify all essential parameters (yellow cells) such as WACC, growth %, and tax rates.
- Real-Time Valuation Adjustments: Automatic recalculations to assess the effects of changes on Wuxi Longsheng's fair value.
- Flexible Excel Template: Designed for quick adjustments, scenario analysis, and in-depth projections.
- Efficient and Precise: Avoid the hassle of building models from the ground up while ensuring accuracy and adaptability.
Key Features
- Comprehensive Historical Data: Access Wuxi Longsheng Technology Co., Ltd’s historical financial statements along with pre-filled projections.
- Customizable Parameters: Modify WACC, tax rates, revenue growth, and EBITDA margins according to your needs.
- Real-Time Valuation: Observe the intrinsic value of Wuxi Longsheng Technology Co., Ltd (300680SZ) update instantly.
- Intuitive Visual Representations: Dashboard visualizations illustrate valuation outcomes and essential metrics clearly.
- Designed for Precision: A sophisticated tool tailored for analysts, investors, and finance professionals.
How It Works
- Step 1: Download the Excel file.
- Step 2: Review the pre-filled Wuxi Longsheng Technology Co., Ltd data (historical and projected).
- Step 3: Modify key assumptions (yellow cells) according to your analysis.
- Step 4: Observe the automatic recalculations for Wuxi Longsheng's intrinsic value.
- Step 5: Utilize the results for your investment decisions or reporting needs.
Why Opt for the Wuxi Longsheng Technology Calculator?
- Precision: Utilizes real-time financial data for utmost accuracy.
- Customizability: Allows users to freely experiment with and adjust inputs.
- Efficiency: Avoid the complexities of creating a DCF model from the ground up.
- High-Quality: Crafted with the insight and functionality expected at the CFO level.
- Intuitive: Simple to navigate, even for users with minimal financial analysis expertise.
Who Will Benefit from This Product?
- Investors: Gain confidence in your investment choices with a top-tier valuation tool tailored for accuracy.
- Financial Analysts: Enhance your efficiency with a pre-structured DCF model that allows for easy customization.
- Consultants: Seamlessly modify the template for engaging client presentations or detailed reports.
- Finance Enthusiasts: Expand your knowledge of valuation methodologies through practical, real-world examples.
- Educators and Students: Utilize it as a hands-on resource for finance-related academic courses.
Explore the opportunities with Wuxi Longsheng Technology Co., Ltd (300680SZ) in this comprehensive guide!
Contents of the Template
- Operating and Balance Sheet Data: Pre-filled historical data and forecasts for Wuxi Longsheng Technology Co., Ltd (300680SZ), encompassing revenue, EBITDA, EBIT, and capital expenditures.
- WACC Calculation: A dedicated sheet for computing the Weighted Average Cost of Capital (WACC), featuring essential parameters such as Beta, risk-free rate, and share price.
- DCF Valuation (Unlevered and Levered): Customizable Discounted Cash Flow models illustrating intrinsic value with comprehensive calculations.
- Financial Statements: Pre-loaded annual and quarterly financial statements to facilitate thorough analysis.
- Key Ratios: A collection of profitability, leverage, and efficiency ratios specific to Wuxi Longsheng Technology Co., Ltd (300680SZ).
- Dashboard and Charts: A visual overview of valuation outputs and assumptions, designed for easy result analysis.
Disclaimer
All information, articles, and product details provided on this website are for general informational and educational purposes only. We do not claim any ownership over, nor do we intend to infringe upon, any trademarks, copyrights, logos, brand names, or other intellectual property mentioned or depicted on this site. Such intellectual property remains the property of its respective owners, and any references here are made solely for identification or informational purposes, without implying any affiliation, endorsement, or partnership.
We make no representations or warranties, express or implied, regarding the accuracy, completeness, or suitability of any content or products presented. Nothing on this website should be construed as legal, tax, investment, financial, medical, or other professional advice. In addition, no part of this site—including articles or product references—constitutes a solicitation, recommendation, endorsement, advertisement, or offer to buy or sell any securities, franchises, or other financial instruments, particularly in jurisdictions where such activity would be unlawful.
All content is of a general nature and may not address the specific circumstances of any individual or entity. It is not a substitute for professional advice or services. Any actions you take based on the information provided here are strictly at your own risk. You accept full responsibility for any decisions or outcomes arising from your use of this website and agree to release us from any liability in connection with your use of, or reliance upon, the content or products found herein.