
|
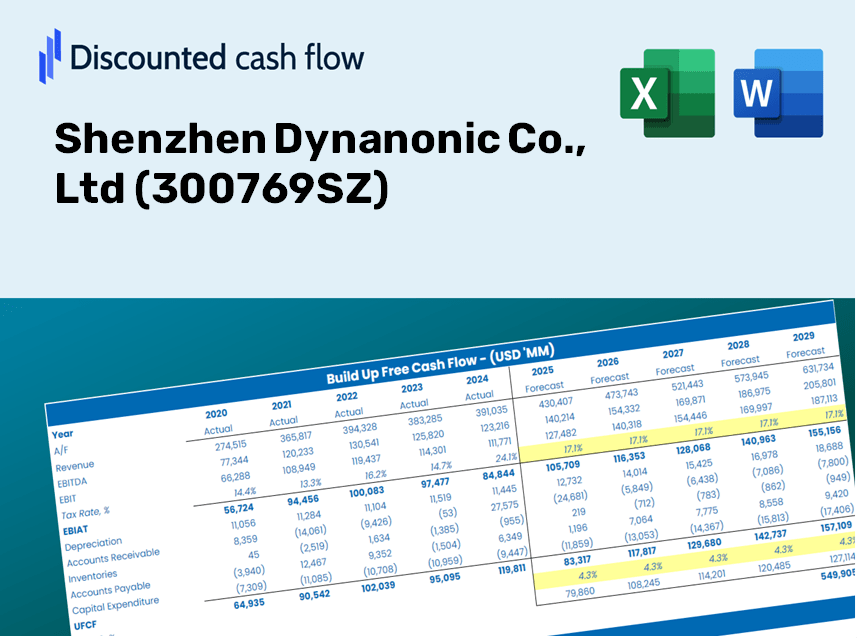
Shenzhen Dynanonic Co., Ltd (300769.SZ) DCF Valuation |
Fully Editable: Tailor To Your Needs In Excel Or Sheets
Professional Design: Trusted, Industry-Standard Templates
Investor-Approved Valuation Models
MAC/PC Compatible, Fully Unlocked
No Expertise Is Needed; Easy To Follow
Shenzhen Dynanonic Co., Ltd (300769.SZ) Bundle
Simplify Shenzhen Dynanonic Co., Ltd (300769SZ) valuation with this customizable DCF Calculator! Featuring real Shenzhen Dynanonic Co., Ltd (300769SZ) financials and adjustable forecast inputs, you can test scenarios and uncover Shenzhen Dynanonic Co., Ltd (300769SZ) fair value in minutes.
Discounted Cash Flow (DCF) - (USD MM)
| Year | AY1 2020 |
AY2 2021 |
AY3 2022 |
AY4 2023 |
AY5 2024 |
FY1 2025 |
FY2 2026 |
FY3 2027 |
FY4 2028 |
FY5 2029 |
|---|---|---|---|---|---|---|---|---|---|---|
| Revenue | 942.1 | 4,954.3 | 22,557.1 | 16,972.5 | 7,612.9 | 9,898.7 | 12,870.7 | 16,735.0 | 21,759.6 | 28,292.7 |
| Revenue Growth, % | 0 | 425.86 | 355.3 | -24.76 | -55.15 | 30.02 | 30.02 | 30.02 | 30.02 | 30.02 |
| EBITDA | 1.5 | 1,138.7 | 3,280.2 | -1,433.3 | -816.8 | 366.5 | 476.6 | 619.7 | 805.7 | 1,047.6 |
| EBITDA, % | 0.16037 | 22.98 | 14.54 | -8.44 | -10.73 | 3.7 | 3.7 | 3.7 | 3.7 | 3.7 |
| Depreciation | 63.6 | 167.0 | 284.1 | 452.0 | 576.7 | 428.0 | 556.6 | 723.7 | 940.9 | 1,223.5 |
| Depreciation, % | 6.75 | 3.37 | 1.26 | 2.66 | 7.58 | 4.32 | 4.32 | 4.32 | 4.32 | 4.32 |
| EBIT | -62.1 | 971.7 | 2,996.1 | -1,885.2 | -1,393.4 | -61.5 | -80.0 | -104.0 | -135.2 | -175.8 |
| EBIT, % | -6.59 | 19.61 | 13.28 | -11.11 | -18.3 | -0.62146 | -0.62146 | -0.62146 | -0.62146 | -0.62146 |
| Total Cash | 1,169.2 | 1,917.2 | 3,513.2 | 4,546.1 | 3,196.1 | 4,415.6 | 5,741.4 | 7,465.2 | 9,706.5 | 12,620.8 |
| Total Cash, percent | .0 | .0 | .0 | .0 | .0 | .0 | .0 | .0 | .0 | .0 |
| Account Receivables | 530.2 | 1,649.0 | 8,815.0 | 3,272.5 | 2,786.3 | 3,653.0 | 4,749.7 | 6,175.8 | 8,030.1 | 10,441.0 |
| Account Receivables, % | 56.27 | 33.28 | 39.08 | 19.28 | 36.6 | 36.9 | 36.9 | 36.9 | 36.9 | 36.9 |
| Inventories | 250.2 | 1,562.4 | 5,133.0 | 845.6 | 981.3 | 1,954.3 | 2,541.1 | 3,304.1 | 4,296.1 | 5,586.0 |
| Inventories, % | 26.55 | 31.54 | 22.76 | 4.98 | 12.89 | 19.74 | 19.74 | 19.74 | 19.74 | 19.74 |
| Accounts Payable | 974.4 | 2,668.0 | 6,687.9 | 4,320.4 | 2,303.3 | 4,735.8 | 6,157.6 | 8,006.4 | 10,410.3 | 13,535.9 |
| Accounts Payable, % | 103.42 | 53.85 | 29.65 | 25.46 | 30.26 | 47.84 | 47.84 | 47.84 | 47.84 | 47.84 |
| Capital Expenditure | -759.7 | -798.6 | -2,556.1 | -1,627.0 | -476.7 | -2,453.6 | -3,190.3 | -4,148.2 | -5,393.7 | -7,013.1 |
| Capital Expenditure, % | -80.64 | -16.12 | -11.33 | -9.59 | -6.26 | -24.79 | -24.79 | -24.79 | -24.79 | -24.79 |
| Tax Rate, % | 24.38 | 24.38 | 24.38 | 24.38 | 24.38 | 24.38 | 24.38 | 24.38 | 24.38 | 24.38 |
| EBITAT | -41.0 | 844.3 | 2,523.7 | -1,411.3 | -1,053.7 | -47.7 | -62.0 | -80.6 | -104.8 | -136.3 |
| Depreciation | ||||||||||
| Changes in Account Receivables | ||||||||||
| Changes in Inventories | ||||||||||
| Changes in Accounts Payable | ||||||||||
| Capital Expenditure | ||||||||||
| UFCF | -543.1 | -524.8 | -6,465.1 | 4,876.1 | -2,620.3 | -1,480.6 | -2,957.4 | -3,845.4 | -5,000.0 | -6,501.2 |
| WACC, % | 10.77 | 11.07 | 11.03 | 10.9 | 10.91 | 10.94 | 10.94 | 10.94 | 10.94 | 10.94 |
| PV UFCF | ||||||||||
| SUM PV UFCF | -13,724.0 | |||||||||
| Long Term Growth Rate, % | 3.50 | |||||||||
| Free cash flow (T + 1) | -6,729 | |||||||||
| Terminal Value | -90,465 | |||||||||
| Present Terminal Value | -53,837 | |||||||||
| Enterprise Value | -67,561 | |||||||||
| Net Debt | 5,114 | |||||||||
| Equity Value | -72,675 | |||||||||
| Diluted Shares Outstanding, MM | 278 | |||||||||
| Equity Value Per Share | -261.33 |
What You Will Receive
- Genuine Shenzhen Dynanonic Data: Comprehensive financials – including revenue and EBIT – derived from real and forecasted figures.
- Complete Customization: Modify all essential parameters (highlighted cells) such as WACC, growth percentages, and tax rates.
- Immediate Valuation Adjustments: Automatic recalculations to evaluate the effects of changes on Shenzhen Dynanonic's fair value.
- Flexible Excel Template: Designed for rapid modifications, scenario analysis, and thorough projections.
- Efficient and Precise: Avoid the hassle of constructing models from the ground up while ensuring accuracy and adaptability.
Key Features
- 🔍 Real-Life 300769SZ Financials: Pre-filled historical and projected data for Shenzhen Dynanonic Co., Ltd.
- ✏️ Fully Customizable Inputs: Adjust all essential parameters (yellow cells) such as WACC, growth %, and tax rates.
- 📊 Professional DCF Valuation: Integrated formulas calculate the intrinsic value of Shenzhen Dynanonic using the Discounted Cash Flow method.
- ⚡ Instant Results: Visualize the valuation of Shenzhen Dynanonic immediately after making adjustments.
- Scenario Analysis: Evaluate and compare results based on different financial assumptions side-by-side.
How It Works
- Step 1: Download the prebuilt Excel template featuring Shenzhen Dynanonic Co., Ltd (300769SZ) data.
- Step 2: Browse through the pre-filled sheets to familiarize yourself with the key metrics.
- Step 3: Modify forecasts and assumptions in the editable yellow cells (WACC, growth, margins).
- Step 4: Instantly see the recalculated results, including the intrinsic value of Shenzhen Dynanonic Co., Ltd (300769SZ).
- Step 5: Use the outputs to make informed investment decisions or generate reports.
Why Select This Calculator from Shenzhen Dynanonic Co., Ltd (300769SZ)?
- Designed for Experts: A sophisticated tool tailored for analysts, CFOs, and industry consultants.
- Comprehensive Data: Equips you with Shenzhen Dynanonic's historical and projected financials for enhanced precision.
- Forecast Simulation: Effortlessly model various scenarios and assumptions.
- Transparent Results: Instantly computes intrinsic value, NPV, and other essential metrics.
- User-Friendly: Easy-to-follow instructions lead you step-by-step through each phase.
Who Should Benefit from This Product?
- Investors: Evaluate Shenzhen Dynanonic Co., Ltd's (300769SZ) valuation before making investment decisions.
- CFOs and Financial Analysts: Optimize valuation methodologies and assess financial forecasts for (300769SZ).
- Startup Founders: Understand how prominent public companies like Shenzhen Dynanonic Co., Ltd (300769SZ) are appraised.
- Consultants: Provide expert valuation analyses and reports tailored to clients involving (300769SZ).
- Students and Educators: Utilize current data from (300769SZ) to practice and instruct on valuation strategies.
What This Template Includes
- Comprehensive DCF Model: Editable template featuring in-depth valuation calculations.
- Real-World Data: Historical and projected financials for Shenzhen Dynanonic Co., Ltd (300769SZ) preloaded for your analysis.
- Customizable Parameters: Modify WACC, growth rates, and tax assumptions to explore various scenarios.
- Financial Statements: Complete annual and quarterly breakdowns for enhanced insights.
- Key Ratios: Integrated analysis on profitability, efficiency, and leverage metrics.
- Dashboard with Visual Outputs: Charts and tables designed for clear, actionable results.
Disclaimer
All information, articles, and product details provided on this website are for general informational and educational purposes only. We do not claim any ownership over, nor do we intend to infringe upon, any trademarks, copyrights, logos, brand names, or other intellectual property mentioned or depicted on this site. Such intellectual property remains the property of its respective owners, and any references here are made solely for identification or informational purposes, without implying any affiliation, endorsement, or partnership.
We make no representations or warranties, express or implied, regarding the accuracy, completeness, or suitability of any content or products presented. Nothing on this website should be construed as legal, tax, investment, financial, medical, or other professional advice. In addition, no part of this site—including articles or product references—constitutes a solicitation, recommendation, endorsement, advertisement, or offer to buy or sell any securities, franchises, or other financial instruments, particularly in jurisdictions where such activity would be unlawful.
All content is of a general nature and may not address the specific circumstances of any individual or entity. It is not a substitute for professional advice or services. Any actions you take based on the information provided here are strictly at your own risk. You accept full responsibility for any decisions or outcomes arising from your use of this website and agree to release us from any liability in connection with your use of, or reliance upon, the content or products found herein.