
|
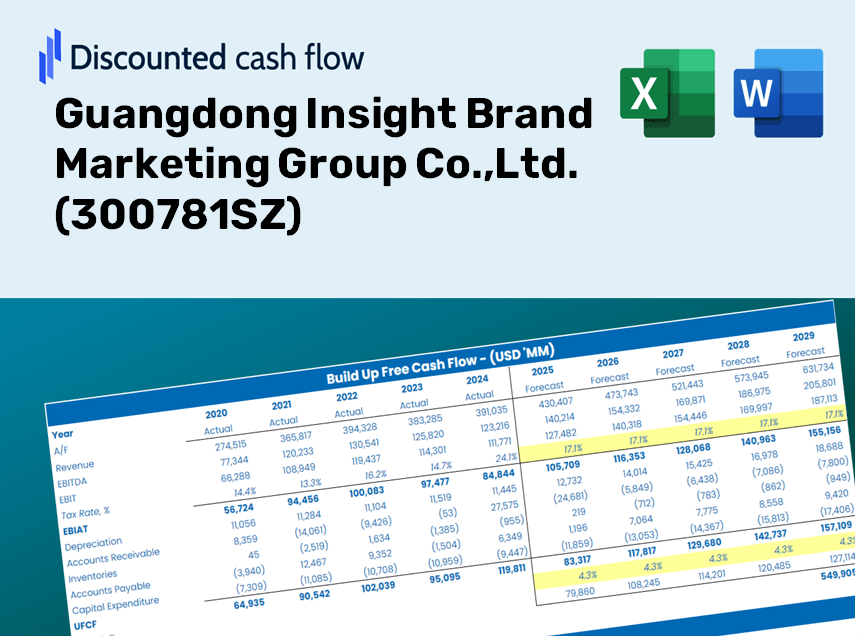
Guangdong Insight Brand Marketing Group Co.,Ltd. (300781.SZ) DCF Valuation |
Fully Editable: Tailor To Your Needs In Excel Or Sheets
Professional Design: Trusted, Industry-Standard Templates
Investor-Approved Valuation Models
MAC/PC Compatible, Fully Unlocked
No Expertise Is Needed; Easy To Follow
Guangdong Insight Brand Marketing Group Co.,Ltd. (300781.SZ) Bundle
Enhance your investment strategy with the (300781SZ) DCF Calculator! Utilize real financial data from Guangdong Insight Brand Marketing Group Co., Ltd., adjust growth projections and expenses, and observe how these modifications affect the intrinsic value of (300781SZ) in real-time.
Discounted Cash Flow (DCF) - (USD MM)
| Year | AY1 2020 |
AY2 2021 |
AY3 2022 |
AY4 2023 |
AY5 2024 |
FY1 2025 |
FY2 2026 |
FY3 2027 |
FY4 2028 |
FY5 2029 |
|---|---|---|---|---|---|---|---|---|---|---|
| Revenue | 319.9 | 624.1 | 485.5 | 536.4 | 883.4 | 1,210.4 | 1,658.4 | 2,272.2 | 3,113.2 | 4,265.5 |
| Revenue Growth, % | 0 | 95.1 | -22.21 | 10.49 | 64.68 | 37.01 | 37.01 | 37.01 | 37.01 | 37.01 |
| EBITDA | 37.1 | 117.5 | 73.4 | 96.5 | -.9 | 153.5 | 210.3 | 288.2 | 394.9 | 541.0 |
| EBITDA, % | 11.6 | 18.82 | 15.11 | 17.99 | -0.10679 | 12.68 | 12.68 | 12.68 | 12.68 | 12.68 |
| Depreciation | 4.7 | 9.6 | 13.1 | 13.4 | 13.7 | 23.6 | 32.3 | 44.3 | 60.7 | 83.2 |
| Depreciation, % | 1.47 | 1.53 | 2.69 | 2.5 | 1.56 | 1.95 | 1.95 | 1.95 | 1.95 | 1.95 |
| EBIT | 32.4 | 107.9 | 60.3 | 83.1 | -14.7 | 129.9 | 178.0 | 243.9 | 334.2 | 457.9 |
| EBIT, % | 10.12 | 17.29 | 12.43 | 15.49 | -1.66 | 10.73 | 10.73 | 10.73 | 10.73 | 10.73 |
| Total Cash | 363.1 | 329.4 | 288.0 | 217.1 | 245.7 | 678.7 | 930.0 | 1,274.2 | 1,745.8 | 2,392.0 |
| Total Cash, percent | .0 | .0 | .0 | .0 | .0 | .0 | .0 | .0 | .0 | .0 |
| Account Receivables | 146.2 | 219.9 | 197.5 | 273.2 | 500.2 | 554.7 | 760.1 | 1,041.4 | 1,426.8 | 1,954.9 |
| Account Receivables, % | 45.68 | 35.23 | 40.68 | 50.94 | 56.62 | 45.83 | 45.83 | 45.83 | 45.83 | 45.83 |
| Inventories | 6.3 | -67.4 | -52.0 | .0 | .0 | -47.3 | -64.8 | -88.8 | -121.7 | -166.7 |
| Inventories, % | 1.96 | -10.8 | -10.7 | 0 | 0 | -3.91 | -3.91 | -3.91 | -3.91 | -3.91 |
| Accounts Payable | 64.2 | 99.2 | 84.7 | 97.7 | 204.1 | 229.2 | 314.1 | 430.3 | 589.6 | 807.9 |
| Accounts Payable, % | 20.05 | 15.9 | 17.44 | 18.21 | 23.1 | 18.94 | 18.94 | 18.94 | 18.94 | 18.94 |
| Capital Expenditure | -.6 | -3.3 | -9.1 | -7.3 | -10.3 | -12.3 | -16.9 | -23.2 | -31.8 | -43.5 |
| Capital Expenditure, % | -0.17278 | -0.53351 | -1.87 | -1.36 | -1.17 | -1.02 | -1.02 | -1.02 | -1.02 | -1.02 |
| Tax Rate, % | -177.47 | -177.47 | -177.47 | -177.47 | -177.47 | -177.47 | -177.47 | -177.47 | -177.47 | -177.47 |
| EBITAT | 15.6 | 59.3 | 30.2 | 42.8 | -40.8 | 79.2 | 108.5 | 148.6 | 203.7 | 279.1 |
| Depreciation | ||||||||||
| Changes in Account Receivables | ||||||||||
| Changes in Inventories | ||||||||||
| Changes in Accounts Payable | ||||||||||
| Capital Expenditure | ||||||||||
| UFCF | -68.5 | 100.6 | 26.5 | -65.7 | -157.9 | 108.4 | 20.9 | 28.7 | 39.3 | 53.9 |
| WACC, % | 10.15 | 10.16 | 10.16 | 10.16 | 10.18 | 10.16 | 10.16 | 10.16 | 10.16 | 10.16 |
| PV UFCF | ||||||||||
| SUM PV UFCF | 197.0 | |||||||||
| Long Term Growth Rate, % | 2.00 | |||||||||
| Free cash flow (T + 1) | 55 | |||||||||
| Terminal Value | 673 | |||||||||
| Present Terminal Value | 415 | |||||||||
| Enterprise Value | 612 | |||||||||
| Net Debt | -84 | |||||||||
| Equity Value | 695 | |||||||||
| Diluted Shares Outstanding, MM | 110 | |||||||||
| Equity Value Per Share | 6.32 |
What You Will Receive
- Authentic 300781SZ Financials: Access to both historical and projected data for precise valuation.
- Customizable Parameters: Adjust WACC, tax rates, revenue growth, and capital expenditures to fit your analysis.
- Instant Calculations: Enjoy automatic determination of intrinsic value and NPV.
- Scenario Evaluation: Explore various scenarios to assess Guangdong Insight Brand Marketing Group Co., Ltd.'s future prospects.
- User-Friendly Interface: Designed for experts while remaining accessible to newcomers.
Key Features
- Customizable Forecast Inputs: Adjust essential parameters such as market expansion, brand equity growth, and advertising expenses.
- Instant DCF Valuation: Automatically computes intrinsic value, net present value, and additional financial metrics.
- High-Precision Accuracy: Leverages Guangdong Insight Brand Marketing Group Co., Ltd.'s real financial data for credible valuation results.
- Effortless Scenario Analysis: Easily evaluate various assumptions and visualize different outcomes.
- Efficiency Booster: Streamline the valuation process by avoiding the need for intricate model development from the ground up.
How This Works
- Download the Template: Gain immediate access to the Excel-based GIBM DCF Calculator for Guangdong Insight Brand Marketing Group Co.,Ltd. (300781SZ).
- Input Your Assumptions: Modify the yellow-highlighted cells for growth projections, WACC, margins, and other variables.
- Instant Calculations: The model automatically recalculates the intrinsic value of Guangdong Insight Brand Marketing Group Co.,Ltd. (300781SZ).
- Test Scenarios: Experiment with different assumptions to assess potential valuation fluctuations.
- Analyze and Decide: Leverage the results to inform your investment or financial evaluation.
Why Opt for This Calculator?
- Reliable Data: Access genuine financial metrics from Guangdong Insight Brand Marketing Group Co., Ltd. to ensure trustworthy valuation outcomes.
- Tailorable: Modify essential factors such as growth rates, WACC, and tax rates to align with your forecasts.
- Efficient: Built-in calculations save time, allowing you to skip the initial setup.
- Expert-Level Tool: Tailored for investors, analysts, and consultants in the field.
- Easy to Use: User-friendly design with clear, step-by-step guidance for everyone.
Who Should Utilize This Service?
- Market Analysts: Develop comprehensive and precise brand evaluation models for competitive analysis.
- Marketing Teams: Assess branding scenarios to inform strategic decision-making.
- Consultants and Advisors: Deliver clients with reliable branding insights for Guangdong Insight Brand Marketing Group Co.,Ltd. (300781SZ).
- Students and Educators: Leverage real-world data to learn and teach brand marketing concepts.
- Business Enthusiasts: Gain insights into how marketing firms like Guangdong Insight are evaluated in the industry.
Contents of the Template
- Historical Data: Contains past financial performance and baseline forecasts for Guangdong Insight Brand Marketing Group Co., Ltd. (300781SZ).
- DCF and Levered DCF Models: Comprehensive templates designed to evaluate the intrinsic value of Guangdong Insight Brand Marketing Group Co., Ltd. (300781SZ).
- WACC Sheet: Pre-configured calculations for the Weighted Average Cost of Capital.
- Editable Inputs: Customizable key drivers such as growth rates, EBITDA percentage, and CAPEX assumptions.
- Quarterly and Annual Statements: Detailed financial breakdowns for Guangdong Insight Brand Marketing Group Co., Ltd. (300781SZ).
- Interactive Dashboard: Dynamically visualize valuation outcomes and projections.
Disclaimer
All information, articles, and product details provided on this website are for general informational and educational purposes only. We do not claim any ownership over, nor do we intend to infringe upon, any trademarks, copyrights, logos, brand names, or other intellectual property mentioned or depicted on this site. Such intellectual property remains the property of its respective owners, and any references here are made solely for identification or informational purposes, without implying any affiliation, endorsement, or partnership.
We make no representations or warranties, express or implied, regarding the accuracy, completeness, or suitability of any content or products presented. Nothing on this website should be construed as legal, tax, investment, financial, medical, or other professional advice. In addition, no part of this site—including articles or product references—constitutes a solicitation, recommendation, endorsement, advertisement, or offer to buy or sell any securities, franchises, or other financial instruments, particularly in jurisdictions where such activity would be unlawful.
All content is of a general nature and may not address the specific circumstances of any individual or entity. It is not a substitute for professional advice or services. Any actions you take based on the information provided here are strictly at your own risk. You accept full responsibility for any decisions or outcomes arising from your use of this website and agree to release us from any liability in connection with your use of, or reliance upon, the content or products found herein.