
|
Sichuan Injet Electric Stock Co.,Ltd. (300820.SZ) DCF Valuation |
Fully Editable: Tailor To Your Needs In Excel Or Sheets
Professional Design: Trusted, Industry-Standard Templates
Investor-Approved Valuation Models
MAC/PC Compatible, Fully Unlocked
No Expertise Is Needed; Easy To Follow
Sichuan Injet Electric Stock Co.,Ltd. (300820.SZ) Bundle
Discover the true potential of Sichuan Injet Electric Stock Co., Ltd. (300820SZ) with our expert-level DCF Calculator! Adjust key assumptions, explore various scenarios, and evaluate how changes affect the valuation of Sichuan Injet Electric Stock Co., Ltd. (300820SZ) – all within a single Excel template.
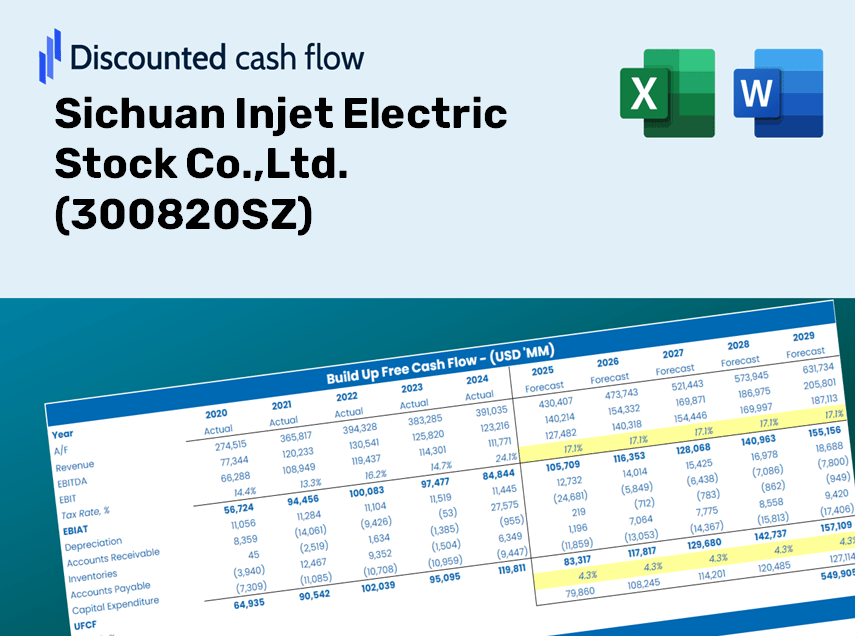
Discounted Cash Flow (DCF) - (USD MM)
| Year | AY1 2020 |
AY2 2021 |
AY3 2022 |
AY4 2023 |
AY5 2024 |
FY1 2025 |
FY2 2026 |
FY3 2027 |
FY4 2028 |
FY5 2029 |
|---|---|---|---|---|---|---|---|---|---|---|
| Revenue | 420.7 | 660.0 | 1,282.6 | 1,769.8 | 1,780.3 | 2,625.0 | 3,870.5 | 5,706.9 | 8,414.7 | 12,407.3 |
| Revenue Growth, % | 0 | 56.87 | 94.34 | 37.99 | 0.59124 | 47.45 | 47.45 | 47.45 | 47.45 | 47.45 |
| EBITDA | 112.7 | 176.3 | 387.1 | 507.1 | 395.2 | 706.3 | 1,041.4 | 1,535.5 | 2,264.0 | 3,338.3 |
| EBITDA, % | 26.78 | 26.72 | 30.18 | 28.65 | 22.2 | 26.91 | 26.91 | 26.91 | 26.91 | 26.91 |
| Depreciation | 6.0 | 7.2 | 15.9 | 22.4 | 33.1 | 36.2 | 53.4 | 78.7 | 116.1 | 171.2 |
| Depreciation, % | 1.44 | 1.09 | 1.24 | 1.27 | 1.86 | 1.38 | 1.38 | 1.38 | 1.38 | 1.38 |
| EBIT | 106.6 | 169.1 | 371.1 | 484.7 | 362.1 | 670.0 | 988.0 | 1,456.7 | 2,147.9 | 3,167.1 |
| EBIT, % | 25.34 | 25.62 | 28.94 | 27.39 | 20.34 | 25.53 | 25.53 | 25.53 | 25.53 | 25.53 |
| Total Cash | 677.8 | 610.4 | 546.5 | 746.2 | 1,121.2 | 1,786.3 | 2,633.9 | 3,883.6 | 5,726.2 | 8,443.2 |
| Total Cash, percent | .0 | .0 | .0 | .0 | .0 | .0 | .0 | .0 | .0 | .0 |
| Account Receivables | 262.0 | 341.6 | 367.3 | 704.8 | 652.7 | 1,150.7 | 1,696.6 | 2,501.6 | 3,688.6 | 5,438.7 |
| Account Receivables, % | 62.29 | 51.76 | 28.64 | 39.82 | 36.67 | 43.83 | 43.83 | 43.83 | 43.83 | 43.83 |
| Inventories | 314.2 | 848.7 | 1,521.6 | 1,838.1 | 1,555.9 | 2,425.9 | 3,576.9 | 5,274.0 | 7,776.4 | 11,466.2 |
| Inventories, % | 74.67 | 128.61 | 118.64 | 103.86 | 87.4 | 92.41 | 92.41 | 92.41 | 92.41 | 92.41 |
| Accounts Payable | 58.9 | 147.0 | 231.0 | 255.3 | 141.8 | 402.6 | 593.6 | 875.2 | 1,290.5 | 1,902.8 |
| Accounts Payable, % | 14 | 22.28 | 18.01 | 14.43 | 7.96 | 15.34 | 15.34 | 15.34 | 15.34 | 15.34 |
| Capital Expenditure | -8.4 | -65.9 | -98.3 | -123.2 | -97.6 | -168.5 | -248.5 | -366.4 | -540.2 | -796.5 |
| Capital Expenditure, % | -2 | -9.99 | -7.66 | -6.96 | -5.48 | -6.42 | -6.42 | -6.42 | -6.42 | -6.42 |
| Tax Rate, % | 17.58 | 17.58 | 17.58 | 17.58 | 17.58 | 17.58 | 17.58 | 17.58 | 17.58 | 17.58 |
| EBITAT | 92.3 | 146.9 | 322.6 | 421.0 | 298.5 | 575.7 | 848.9 | 1,251.7 | 1,845.6 | 2,721.3 |
| Depreciation | ||||||||||
| Changes in Account Receivables | ||||||||||
| Changes in Inventories | ||||||||||
| Changes in Accounts Payable | ||||||||||
| Capital Expenditure | ||||||||||
| UFCF | -427.4 | -437.8 | -374.4 | -309.5 | 454.7 | -663.6 | -852.1 | -1,256.4 | -1,852.6 | -2,731.6 |
| WACC, % | 4.65 | 4.65 | 4.65 | 4.65 | 4.65 | 4.65 | 4.65 | 4.65 | 4.65 | 4.65 |
| PV UFCF | ||||||||||
| SUM PV UFCF | -6,229.7 | |||||||||
| Long Term Growth Rate, % | 4.00 | |||||||||
| Free cash flow (T + 1) | -2,841 | |||||||||
| Terminal Value | -438,283 | |||||||||
| Present Terminal Value | -349,218 | |||||||||
| Enterprise Value | -355,448 | |||||||||
| Net Debt | -555 | |||||||||
| Equity Value | -354,892 | |||||||||
| Diluted Shares Outstanding, MM | 221 | |||||||||
| Equity Value Per Share | -1,605.37 |
Benefits of Choosing Us
- Pre-Filled Financial Model: Access to Sichuan Injet Electric's actual financial data for accurate DCF valuation.
- Comprehensive Forecast Management: Modify key factors such as revenue growth, profit margins, WACC, and more.
- Real-Time Calculations: Automatic updates provide immediate feedback as you adjust inputs.
- Investor-Ready Format: A polished Excel template crafted for high-quality financial valuation.
- Flexible and Reusable: Designed for adaptability, making it easy to use for multiple detailed forecasts.
Key Features
- Comprehensive [Symbol] Data: Pre-populated with Sichuan Injet Electric Stock Co., Ltd.'s historical performance metrics and future forecasts.
- Customizable Assumptions: Modify projections for revenue growth, profit margins, discount rates, tax implications, and capital investments.
- Interactive Valuation Framework: Automatically refreshes Net Present Value (NPV) and intrinsic value based on your tailored inputs.
- Advanced Scenario Analysis: Develop various forecasting scenarios to explore different valuation possibilities.
- Intuitive User Interface: Designed for ease of use, making it accessible for both experts and novices in finance.
How It Functions
- Step 1: Download the Excel document.
- Step 2: Examine the pre-filled data for Sichuan Injet Electric (300820SZ), including historical and forecasted figures.
- Step 3: Modify key assumptions (highlighted in yellow) according to your insights.
- Step 4: Observe the automatic recalculations for the intrinsic value of Sichuan Injet Electric.
- Step 5: Utilize the results for making investment decisions or for reporting purposes.
Why Choose This Calculator for Sichuan Injet Electric Stock Co., Ltd. (300820SZ)?
- Designed for Industry Experts: A sophisticated tool utilized by analysts, CFOs, and consultants in the electric sector.
- Accurate Financial Data: Historical and projected financial figures for Sichuan Injet preloaded for reliable analysis.
- Forecast Simulation: Easily test various scenarios and assumptions to evaluate potential outcomes.
- Comprehensive Results: Automatically computes intrinsic value, NPV, and other essential metrics.
- User-Friendly Interface: Step-by-step guidance ensures a smooth and straightforward experience.
Who Can Benefit from This Product?
- Investors: Accurately assess the fair value of Sichuan Injet Electric Stock Co., Ltd. (300820SZ) before making investment choices.
- CFOs: Utilize a high-quality DCF model for precise financial reporting and analysis for Sichuan Injet Electric Stock Co., Ltd. (300820SZ).
- Consultants: Efficiently tailor the template for valuation reports catered to clients of Sichuan Injet Electric Stock Co., Ltd. (300820SZ).
- Entrepreneurs: Discover financial modeling techniques employed by leading companies in the industry, including Sichuan Injet Electric Stock Co., Ltd. (300820SZ).
- Educators: Implement it as a resource to teach valuation methods specifically related to Sichuan Injet Electric Stock Co., Ltd. (300820SZ).
Contents of the Template
- Preloaded 300820SZ Data: Historical and forecasted financial metrics, including revenue, EBIT, and capital expenditures.
- DCF and WACC Models: Professional sheets designed for calculating intrinsic value and Weighted Average Cost of Capital.
- Editable Inputs: Cells highlighted in yellow for modifying revenue growth, tax rates, and discount rates.
- Financial Statements: Detailed annual and quarterly financial data for comprehensive analysis.
- Key Ratios: Insights into profitability, leverage, and efficiency ratios to assess financial performance.
- Dashboard and Charts: Visual representations of valuation results and underlying assumptions.
Disclaimer
All information, articles, and product details provided on this website are for general informational and educational purposes only. We do not claim any ownership over, nor do we intend to infringe upon, any trademarks, copyrights, logos, brand names, or other intellectual property mentioned or depicted on this site. Such intellectual property remains the property of its respective owners, and any references here are made solely for identification or informational purposes, without implying any affiliation, endorsement, or partnership.
We make no representations or warranties, express or implied, regarding the accuracy, completeness, or suitability of any content or products presented. Nothing on this website should be construed as legal, tax, investment, financial, medical, or other professional advice. In addition, no part of this site—including articles or product references—constitutes a solicitation, recommendation, endorsement, advertisement, or offer to buy or sell any securities, franchises, or other financial instruments, particularly in jurisdictions where such activity would be unlawful.
All content is of a general nature and may not address the specific circumstances of any individual or entity. It is not a substitute for professional advice or services. Any actions you take based on the information provided here are strictly at your own risk. You accept full responsibility for any decisions or outcomes arising from your use of this website and agree to release us from any liability in connection with your use of, or reliance upon, the content or products found herein.