
|
Sineng Electric Co.,Ltd. (300827.SZ) DCF Valuation |
Fully Editable: Tailor To Your Needs In Excel Or Sheets
Professional Design: Trusted, Industry-Standard Templates
Investor-Approved Valuation Models
MAC/PC Compatible, Fully Unlocked
No Expertise Is Needed; Easy To Follow
Sineng Electric Co.,Ltd. (300827.SZ) Bundle
Gain insights into your Sineng Electric Co., Ltd. (300827SZ) valuation analysis with our sophisticated DCF Calculator! This Excel template, preloaded with accurate (300827SZ) data, enables you to adjust forecasts and assumptions to determine the intrinsic value of Sineng Electric Co., Ltd. with precision.
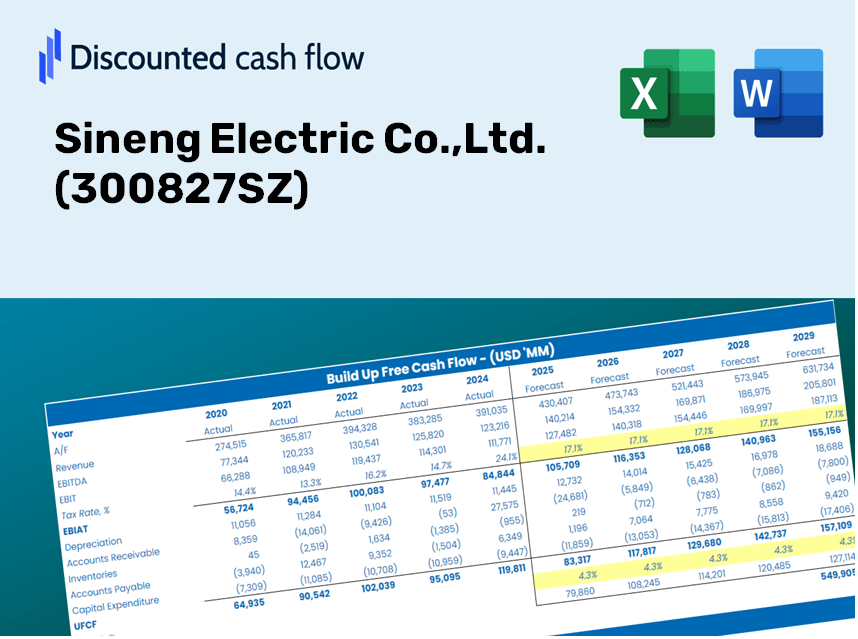
Discounted Cash Flow (DCF) - (USD MM)
| Year | AY1 2020 |
AY2 2021 |
AY3 2022 |
AY4 2023 |
AY5 2024 |
FY1 2025 |
FY2 2026 |
FY3 2027 |
FY4 2028 |
FY5 2029 |
|---|---|---|---|---|---|---|---|---|---|---|
| Revenue | 1,004.0 | 1,092.4 | 2,338.5 | 4,932.7 | 4,773.4 | 4,794.1 | 4,814.8 | 4,835.7 | 4,856.6 | 4,877.7 |
| Revenue Growth, % | 0 | 8.8 | 114.08 | 110.93 | -3.23 | 0.43314 | 0.43314 | 0.43314 | 0.43314 | 0.43314 |
| EBITDA | 89.0 | 78.8 | 106.4 | 336.5 | 534.5 | 370.6 | 372.2 | 373.8 | 375.5 | 377.1 |
| EBITDA, % | 8.87 | 7.22 | 4.55 | 6.82 | 11.2 | 7.73 | 7.73 | 7.73 | 7.73 | 7.73 |
| Depreciation | 11.7 | 15.0 | 27.9 | 39.7 | 55.4 | 54.6 | 54.9 | 55.1 | 55.3 | 55.6 |
| Depreciation, % | 1.16 | 1.37 | 1.19 | 0.80391 | 1.16 | 1.14 | 1.14 | 1.14 | 1.14 | 1.14 |
| EBIT | 77.3 | 63.8 | 78.5 | 296.9 | 479.1 | 316.0 | 317.4 | 318.8 | 320.1 | 321.5 |
| EBIT, % | 7.7 | 5.84 | 3.36 | 6.02 | 10.04 | 6.59 | 6.59 | 6.59 | 6.59 | 6.59 |
| Total Cash | 836.6 | 800.2 | 1,587.5 | 2,057.9 | 2,425.8 | 3,039.5 | 3,052.7 | 3,065.9 | 3,079.2 | 3,092.5 |
| Total Cash, percent | .0 | .0 | .0 | .0 | .0 | .0 | .0 | .0 | .0 | .0 |
| Account Receivables | 740.0 | 704.0 | 1,159.5 | 2,410.4 | 2,674.2 | 2,805.7 | 2,817.9 | 2,830.1 | 2,842.3 | 2,854.7 |
| Account Receivables, % | 73.7 | 64.45 | 49.58 | 48.87 | 56.02 | 58.52 | 58.52 | 58.52 | 58.52 | 58.52 |
| Inventories | 386.8 | 697.8 | 1,336.8 | 1,332.1 | 1,457.7 | 2,081.7 | 2,090.7 | 2,099.7 | 2,108.8 | 2,118.0 |
| Inventories, % | 38.52 | 63.88 | 57.16 | 27.01 | 30.54 | 43.42 | 43.42 | 43.42 | 43.42 | 43.42 |
| Accounts Payable | 1,100.8 | 1,558.3 | 2,323.9 | 3,761.7 | 3,857.9 | 4,376.6 | 4,395.5 | 4,414.5 | 4,433.7 | 4,452.9 |
| Accounts Payable, % | 109.64 | 142.65 | 99.37 | 76.26 | 80.82 | 91.29 | 91.29 | 91.29 | 91.29 | 91.29 |
| Capital Expenditure | -52.3 | -138.4 | -106.9 | -288.2 | -408.6 | -353.4 | -354.9 | -356.5 | -358.0 | -359.6 |
| Capital Expenditure, % | -5.21 | -12.67 | -4.57 | -5.84 | -8.56 | -7.37 | -7.37 | -7.37 | -7.37 | -7.37 |
| Tax Rate, % | 9.59 | 9.59 | 9.59 | 9.59 | 9.59 | 9.59 | 9.59 | 9.59 | 9.59 | 9.59 |
| EBITAT | 78.5 | 63.1 | 83.7 | 284.0 | 433.2 | 306.5 | 307.8 | 309.2 | 310.5 | 311.9 |
| Depreciation | ||||||||||
| Changes in Account Receivables | ||||||||||
| Changes in Inventories | ||||||||||
| Changes in Accounts Payable | ||||||||||
| Capital Expenditure | ||||||||||
| UFCF | 11.9 | 122.2 | -324.2 | 226.9 | -213.1 | -229.1 | 5.5 | 5.6 | 5.6 | 5.6 |
| WACC, % | 4.54 | 4.53 | 4.54 | 4.52 | 4.49 | 4.52 | 4.52 | 4.52 | 4.52 | 4.52 |
| PV UFCF | ||||||||||
| SUM PV UFCF | -200.1 | |||||||||
| Long Term Growth Rate, % | 4.00 | |||||||||
| Free cash flow (T + 1) | 6 | |||||||||
| Terminal Value | 1,116 | |||||||||
| Present Terminal Value | 895 | |||||||||
| Enterprise Value | 694 | |||||||||
| Net Debt | -794 | |||||||||
| Equity Value | 1,488 | |||||||||
| Diluted Shares Outstanding, MM | 358 | |||||||||
| Equity Value Per Share | 4.16 |
What You Will Receive
- Flexible Assumption Inputs: Effortlessly adjust parameters (growth %, profit margins, discount rates) to explore various scenarios.
- Industry-Specific Data: Sineng Electric Co., Ltd.’s financial information pre-loaded to accelerate your evaluation.
- Instant DCF Calculations: The template automatically computes Net Present Value (NPV) and intrinsic value for you.
- Tailorable and Professional Design: A refined Excel model that meets your valuation requirements.
- Designed for Analysts and Investors: Perfect for assessing forecasts, validating strategies, and enhancing efficiency.
Key Features
- Comprehensive Data: Sineng Electric's historical financial statements and preset projections.
- Customizable Inputs: Modify WACC, tax rates, revenue growth, and EBITDA margins as needed.
- Real-Time Results: View Sineng Electric’s intrinsic value updating instantly.
- User-Friendly Visuals: Dashboard graphs illustrate valuation outcomes and essential metrics.
- Precision Engineered: Designed for analysts, investors, and finance professionals seeking accuracy.
How It Functions
- Step 1: Download the prebuilt Excel template containing data for Sineng Electric Co., Ltd. (300827SZ).
- Step 2: Navigate through the pre-filled sheets to familiarize yourself with the essential metrics.
- Step 3: Modify the forecasts and assumptions in the editable yellow cells (WACC, growth, margins).
- Step 4: Instantly see the recalibrated results, including the intrinsic value of Sineng Electric Co., Ltd. (300827SZ).
- Step 5: Use the outputs to make well-informed investment choices or to create reports.
Why Choose Sineng Electric Co., Ltd. (300827SZ)?
- Save Time: Skip the hassle of developing financial models from the ground up – our tools are ready for immediate use.
- Enhance Accuracy: Access to dependable financial data and formulas minimizes valuation errors.
- Fully Customizable: Adapt the model to align with your specific assumptions and forecasts.
- User-Friendly: Intuitive charts and outputs simplify result analysis.
- Endorsed by Professionals: Created for industry experts who prioritize both precision and functionality.
Who Can Benefit From This Product?
- Individual Investors: Gain clarity on buying or selling shares of Sineng Electric Co., Ltd. (300827SZ).
- Financial Analysts: Enhance your valuation procedures with accessible financial models specific to Sineng Electric.
- Consultants: Provide clients with precise and timely valuation insights related to Sineng Electric Co., Ltd. (300827SZ).
- Business Owners: Discover how large entities like Sineng Electric are valued to inform your own business strategies.
- Finance Students: Acquire practical valuation skills with real data and case studies involving Sineng Electric Co., Ltd. (300827SZ).
What the Template Includes
- Historical Data: Contains Sineng Electric’s previous financial results and foundational projections.
- DCF and Levered DCF Models: Comprehensive templates for assessing Sineng Electric's intrinsic value.
- WACC Sheet: Pre-calculated metrics for the Weighted Average Cost of Capital.
- Editable Inputs: Customize essential variables such as growth rates, EBITDA margins, and CAPEX assumptions.
- Quarterly and Annual Statements: A thorough analysis of Sineng Electric’s financial performance.
- Interactive Dashboard: Dynamically visualize evaluation results and forecasts.
Disclaimer
All information, articles, and product details provided on this website are for general informational and educational purposes only. We do not claim any ownership over, nor do we intend to infringe upon, any trademarks, copyrights, logos, brand names, or other intellectual property mentioned or depicted on this site. Such intellectual property remains the property of its respective owners, and any references here are made solely for identification or informational purposes, without implying any affiliation, endorsement, or partnership.
We make no representations or warranties, express or implied, regarding the accuracy, completeness, or suitability of any content or products presented. Nothing on this website should be construed as legal, tax, investment, financial, medical, or other professional advice. In addition, no part of this site—including articles or product references—constitutes a solicitation, recommendation, endorsement, advertisement, or offer to buy or sell any securities, franchises, or other financial instruments, particularly in jurisdictions where such activity would be unlawful.
All content is of a general nature and may not address the specific circumstances of any individual or entity. It is not a substitute for professional advice or services. Any actions you take based on the information provided here are strictly at your own risk. You accept full responsibility for any decisions or outcomes arising from your use of this website and agree to release us from any liability in connection with your use of, or reliance upon, the content or products found herein.