
|
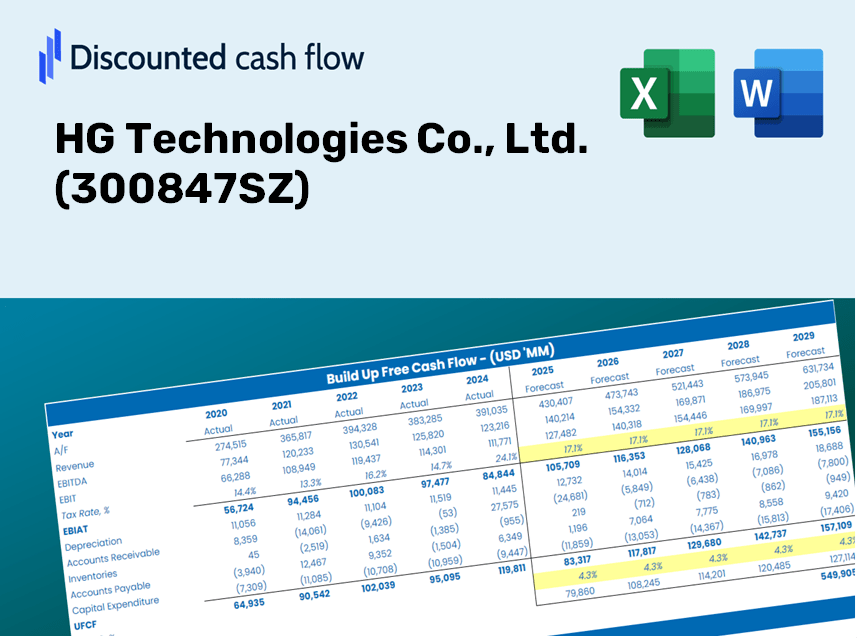
HG Technologies Co., Ltd. (300847.SZ) DCF Valuation |
Fully Editable: Tailor To Your Needs In Excel Or Sheets
Professional Design: Trusted, Industry-Standard Templates
Investor-Approved Valuation Models
MAC/PC Compatible, Fully Unlocked
No Expertise Is Needed; Easy To Follow
HG Technologies Co., Ltd. (300847.SZ) Bundle
Discover the true worth of HG Technologies Co., Ltd. (300847SZ) with our advanced DCF Calculator! Adjust essential assumptions, explore various scenarios, and evaluate how different factors influence HG Technologies Co., Ltd. (300847SZ) valuation – all within a single Excel template.
Discounted Cash Flow (DCF) - (USD MM)
| Year | AY1 2020 |
AY2 2021 |
AY3 2022 |
AY4 2023 |
AY5 2024 |
FY1 2025 |
FY2 2026 |
FY3 2027 |
FY4 2028 |
FY5 2029 |
|---|---|---|---|---|---|---|---|---|---|---|
| Revenue | 874.3 | 1,005.7 | 1,085.2 | 1,069.4 | 1,181.7 | 1,276.1 | 1,378.2 | 1,488.3 | 1,607.3 | 1,735.8 |
| Revenue Growth, % | 0 | 15.03 | 7.9 | -1.46 | 10.5 | 7.99 | 7.99 | 7.99 | 7.99 | 7.99 |
| EBITDA | 138.2 | 169.0 | 166.1 | 152.2 | 187.5 | 199.1 | 215.0 | 232.2 | 250.8 | 270.9 |
| EBITDA, % | 15.81 | 16.81 | 15.3 | 14.23 | 15.87 | 15.6 | 15.6 | 15.6 | 15.6 | 15.6 |
| Depreciation | 34.2 | 41.2 | 40.6 | 44.7 | 46.3 | 50.7 | 54.7 | 59.1 | 63.8 | 68.9 |
| Depreciation, % | 3.91 | 4.1 | 3.75 | 4.18 | 3.92 | 3.97 | 3.97 | 3.97 | 3.97 | 3.97 |
| EBIT | 104.1 | 127.9 | 125.4 | 107.4 | 141.2 | 148.5 | 160.3 | 173.2 | 187.0 | 201.9 |
| EBIT, % | 11.9 | 12.71 | 11.56 | 10.05 | 11.95 | 11.63 | 11.63 | 11.63 | 11.63 | 11.63 |
| Total Cash | 557.0 | 587.9 | 412.7 | 512.0 | 663.4 | 674.3 | 728.3 | 786.5 | 849.4 | 917.3 |
| Total Cash, percent | .0 | .0 | .0 | .0 | .0 | .0 | .0 | .0 | .0 | .0 |
| Account Receivables | 152.4 | 165.9 | 189.0 | 180.5 | 176.5 | 212.3 | 229.2 | 247.5 | 267.3 | 288.7 |
| Account Receivables, % | 17.43 | 16.5 | 17.41 | 16.88 | 14.94 | 16.63 | 16.63 | 16.63 | 16.63 | 16.63 |
| Inventories | 172.9 | 200.5 | 231.4 | 221.9 | 241.5 | 260.9 | 281.7 | 304.3 | 328.6 | 354.9 |
| Inventories, % | 19.78 | 19.93 | 21.32 | 20.75 | 20.44 | 20.44 | 20.44 | 20.44 | 20.44 | 20.44 |
| Accounts Payable | 91.2 | 86.4 | 79.9 | 83.8 | 103.0 | 109.6 | 118.3 | 127.8 | 138.0 | 149.0 |
| Accounts Payable, % | 10.43 | 8.59 | 7.36 | 7.83 | 8.72 | 8.59 | 8.59 | 8.59 | 8.59 | 8.59 |
| Capital Expenditure | -40.7 | -32.7 | -258.1 | -22.4 | -12.8 | -89.0 | -96.1 | -103.8 | -112.1 | -121.1 |
| Capital Expenditure, % | -4.66 | -3.25 | -23.79 | -2.09 | -1.08 | -6.97 | -6.97 | -6.97 | -6.97 | -6.97 |
| Tax Rate, % | 12.12 | 12.12 | 12.12 | 12.12 | 12.12 | 12.12 | 12.12 | 12.12 | 12.12 | 12.12 |
| EBITAT | 90.9 | 110.1 | 109.3 | 95.8 | 124.1 | 130.0 | 140.3 | 151.6 | 163.7 | 176.8 |
| Depreciation | ||||||||||
| Changes in Account Receivables | ||||||||||
| Changes in Inventories | ||||||||||
| Changes in Accounts Payable | ||||||||||
| Capital Expenditure | ||||||||||
| UFCF | -149.8 | 72.8 | -168.6 | 140.0 | 161.2 | 43.1 | 69.9 | 75.5 | 81.5 | 88.0 |
| WACC, % | 7.61 | 7.61 | 7.61 | 7.61 | 7.61 | 7.61 | 7.61 | 7.61 | 7.61 | 7.61 |
| PV UFCF | ||||||||||
| SUM PV UFCF | 282.7 | |||||||||
| Long Term Growth Rate, % | 2.00 | |||||||||
| Free cash flow (T + 1) | 90 | |||||||||
| Terminal Value | 1,601 | |||||||||
| Present Terminal Value | 1,109 | |||||||||
| Enterprise Value | 1,392 | |||||||||
| Net Debt | -661 | |||||||||
| Equity Value | 2,053 | |||||||||
| Diluted Shares Outstanding, MM | 296 | |||||||||
| Equity Value Per Share | 6.93 |
What You Will Receive
- Authentic HG Technologies Financial Data: Pre-loaded with historical and forecasted data for in-depth analysis.
- Completely Customizable Template: Easily adjust critical inputs such as revenue growth, WACC, and EBITDA percentage.
- Instant Calculations: Watch the intrinsic value of HG Technologies update in real-time as you modify the inputs.
- Professional Valuation Tool: Tailored for investors, analysts, and consultants who require precise DCF assessments.
- User-Friendly Interface: Intuitive layout and straightforward instructions suitable for all skill levels.
Key Features
- 🔍 Real-Life HG Technologies Financials: Pre-filled historical and projected data for HG Technologies Co., Ltd. (300847SZ).
- ✏️ Fully Customizable Inputs: Modify essential parameters (yellow cells) such as WACC, growth %, and tax rates.
- 📊 Professional DCF Valuation: Integrated formulas assess HG Technologies' intrinsic value using the Discounted Cash Flow method.
- ⚡ Instant Results: Visualize HG Technologies' valuation immediately upon making adjustments.
- Scenario Analysis: Evaluate and compare different outcomes for various financial assumptions side-by-side.
How It Functions
- Download: Get the pre-formatted Excel file containing HG Technologies Co., Ltd. ([300847SZ]) financial data.
- Customize: Modify projections, including revenue growth, EBITDA percentage, and WACC.
- Real-Time Updates: The intrinsic value and NPV calculations refresh automatically as you make changes.
- Scenario Analysis: Develop various forecasts and compare results instantly.
- Informed Decisions: Leverage the valuation outcomes to shape your investment approach.
Why Opt for HG Technologies Co., Ltd. (300847SZ) Calculator?
- Designed for Experts: A sophisticated tool favored by analysts, CFOs, and business consultants.
- Accurate Data: Preloaded historical and projected financial information for HG Technologies ensures precision.
- Flexible Forecasting: Effortlessly test various scenarios and assumptions with our simulator.
- Concise Results: Automatically generates intrinsic value, NPV, and essential financial metrics.
- User-Friendly: Intuitive step-by-step guidance makes the process straightforward.
Who Can Benefit from HG Technologies Co., Ltd. (300847SZ)?
- Individual Investors: Empower yourself with the knowledge to make informed trading decisions regarding HG Technologies Co., Ltd. (300847SZ).
- Financial Analysts: Enhance your evaluation workflows with accessible financial models tailored for HG Technologies Co., Ltd. (300847SZ).
- Consultants: Provide clients with precise valuation insights about HG Technologies Co., Ltd. (300847SZ) efficiently and expertly.
- Business Owners: Gain a deeper understanding of how companies like HG Technologies Co., Ltd. (300847SZ) are valued to inform your strategic direction.
- Finance Students: Acquire practical knowledge on valuation methodologies using the real-world data provided by HG Technologies Co., Ltd. (300847SZ).
Contents of the Template
- Historical Data: Comprehensive overview of HG Technologies Co., Ltd.'s past financial performance and foundational forecasts.
- DCF and Levered DCF Models: In-depth templates for assessing the intrinsic value of HG Technologies Co., Ltd. (300847SZ).
- WACC Sheet: Pre-constructed calculations for the Weighted Average Cost of Capital.
- Editable Inputs: Adjust critical variables such as growth rates, EBITDA percentages, and CAPEX assumptions.
- Quarterly and Annual Statements: Thorough analysis of HG Technologies Co., Ltd.'s financial data.
- Interactive Dashboard: Dynamic visualization of valuation outcomes and future projections.
Disclaimer
All information, articles, and product details provided on this website are for general informational and educational purposes only. We do not claim any ownership over, nor do we intend to infringe upon, any trademarks, copyrights, logos, brand names, or other intellectual property mentioned or depicted on this site. Such intellectual property remains the property of its respective owners, and any references here are made solely for identification or informational purposes, without implying any affiliation, endorsement, or partnership.
We make no representations or warranties, express or implied, regarding the accuracy, completeness, or suitability of any content or products presented. Nothing on this website should be construed as legal, tax, investment, financial, medical, or other professional advice. In addition, no part of this site—including articles or product references—constitutes a solicitation, recommendation, endorsement, advertisement, or offer to buy or sell any securities, franchises, or other financial instruments, particularly in jurisdictions where such activity would be unlawful.
All content is of a general nature and may not address the specific circumstances of any individual or entity. It is not a substitute for professional advice or services. Any actions you take based on the information provided here are strictly at your own risk. You accept full responsibility for any decisions or outcomes arising from your use of this website and agree to release us from any liability in connection with your use of, or reliance upon, the content or products found herein.