
|
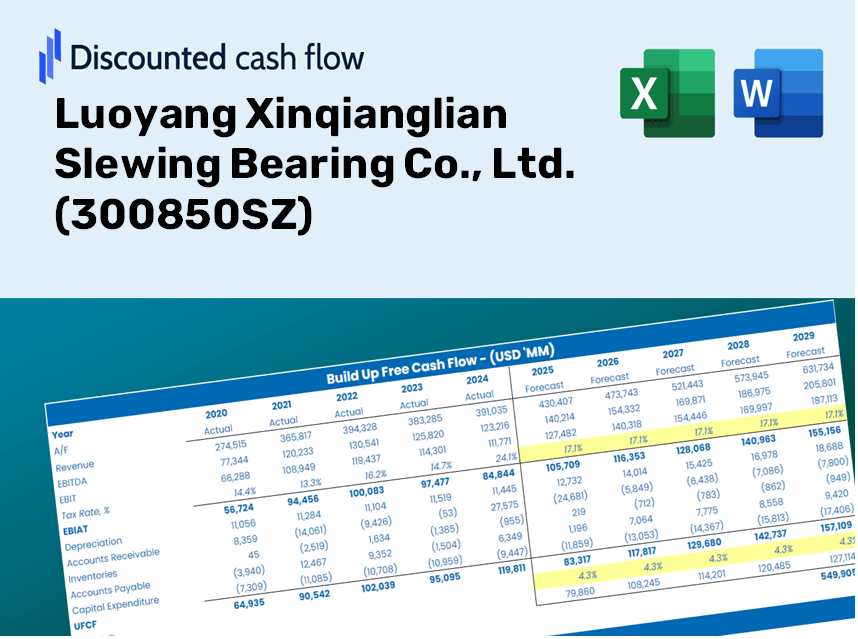
Luoyang Xinqianglian Slewing Bearing Co., Ltd. (300850.SZ) DCF Valuation |
Fully Editable: Tailor To Your Needs In Excel Or Sheets
Professional Design: Trusted, Industry-Standard Templates
Investor-Approved Valuation Models
MAC/PC Compatible, Fully Unlocked
No Expertise Is Needed; Easy To Follow
Luoyang Xinqianglian Slewing Bearing Co., Ltd. (300850.SZ) Bundle
As an investor or analyst, this (300850SZ) DCF Calculator is your go-to resource for accurate valuation. Loaded with real data from Luoyang Xinqianglian Slewing Bearing Co., Ltd., you can adjust forecasts and instantly observe the effects.
What You Will Gain
- Authentic LUOYANG XINQIANGLIAN Financials: Comprehensive historical and projected data for precise valuation.
- Customizable Inputs: Adjust WACC, tax rates, revenue growth, and capital expenditures as needed.
- Automatic Calculations: Intrinsic value and NPV are calculated in real-time.
- Scenario Analysis: Explore various scenarios to assess the future performance of Luoyang Xinqianglian.
- User-Friendly Design: Crafted for professionals while remaining accessible to newcomers.
Key Features
- Accurate Historical Data for Luoyang Xinqianglian: Pre-loaded with the historical financial performance and future projections for Luoyang Xinqianglian Slewing Bearing Co., Ltd. (300850SZ).
- Comprehensive Input Customization: Tailor variables such as revenue growth, profit margins, discount rates, tax rates, and capital expenditures to your needs.
- Dynamic Valuation Framework: Automatic recalculation of Net Present Value (NPV) and intrinsic value in response to your modifications.
- Scenario Analysis: Develop various forecasting scenarios to explore different valuation results.
- User-Centric Interface: Intuitive and organized, catering to both seasoned professionals and newcomers.
How It Functions
- Download: Obtain the pre-configured Excel file containing Luoyang Xinqianglian's financial data.
- Customize: Tailor projections such as revenue growth, EBITDA margin, and WACC as per your needs.
- Update Automatically: The intrinsic value and NPV calculations refresh in real-time.
- Test Scenarios: Generate various forecasts and juxtapose outcomes without delay.
- Make Decisions: Leverage the valuation findings to inform your investment approach.
Why Choose Luoyang Xinqianglian Slewing Bearing Co., Ltd. (300850SZ)?
- All-in-One Solution: Offers extensive slewing bearing analysis and performance metrics in a single platform.
- Flexible Options: Modify highlighted parameters to explore various operational scenarios.
- In-Depth Analysis: Automatically computes key performance indicators and market potential for your projects.
- Rich Data Repository: Access to historical and projected data to provide solid foundations for decision-making.
- Industry Expertise: Perfect for engineers, manufacturers, and business strategists looking for reliable bearing solutions.
Who Can Benefit from Our Products?
- Investors: Accurately assess the fair value of Luoyang Xinqianglian Slewing Bearing Co., Ltd. (300850SZ) before making investment choices.
- CFOs: Utilize a high-quality DCF model for in-depth financial reporting and analysis.
- Consultants: Seamlessly modify the template for client valuation reports.
- Entrepreneurs: Discover financial modeling insights used by leading companies.
- Educators: Employ it as a teaching resource to illustrate various valuation methods.
Contents of the Template
- Pre-Filled DCF Model: Financial data for Luoyang Xinqianglian Slewing Bearing Co., Ltd. (300850SZ) preloaded for immediate analysis.
- WACC Calculator: Comprehensive calculations for the Weighted Average Cost of Capital.
- Financial Ratios: Assess profitability, leverage, and operational efficiency of Luoyang Xinqianglian Slewing Bearing Co., Ltd. (300850SZ).
- Editable Inputs: Customize assumptions like growth rates, profit margins, and capital expenditures to align with your analysis.
- Financial Statements: Access annual and quarterly reports to facilitate thorough evaluation.
- Interactive Dashboard: Visualize essential valuation metrics and results with ease.
Disclaimer
All information, articles, and product details provided on this website are for general informational and educational purposes only. We do not claim any ownership over, nor do we intend to infringe upon, any trademarks, copyrights, logos, brand names, or other intellectual property mentioned or depicted on this site. Such intellectual property remains the property of its respective owners, and any references here are made solely for identification or informational purposes, without implying any affiliation, endorsement, or partnership.
We make no representations or warranties, express or implied, regarding the accuracy, completeness, or suitability of any content or products presented. Nothing on this website should be construed as legal, tax, investment, financial, medical, or other professional advice. In addition, no part of this site—including articles or product references—constitutes a solicitation, recommendation, endorsement, advertisement, or offer to buy or sell any securities, franchises, or other financial instruments, particularly in jurisdictions where such activity would be unlawful.
All content is of a general nature and may not address the specific circumstances of any individual or entity. It is not a substitute for professional advice or services. Any actions you take based on the information provided here are strictly at your own risk. You accept full responsibility for any decisions or outcomes arising from your use of this website and agree to release us from any liability in connection with your use of, or reliance upon, the content or products found herein.