
|
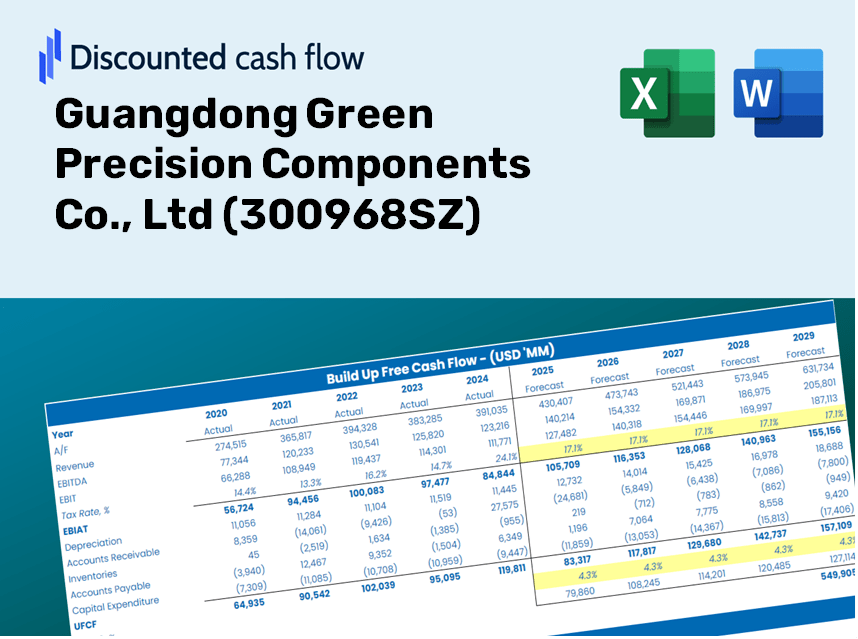
Guangdong Green Precision Components Co., Ltd (300968.SZ) DCF Valuation |
Fully Editable: Tailor To Your Needs In Excel Or Sheets
Professional Design: Trusted, Industry-Standard Templates
Investor-Approved Valuation Models
MAC/PC Compatible, Fully Unlocked
No Expertise Is Needed; Easy To Follow
Guangdong Green Precision Components Co., Ltd (300968.SZ) Bundle
Looking to assess the intrinsic value of Guangdong Green Precision Components Co., Ltd? Our (300968SZ) DCF Calculator integrates real-world data with extensive customization features, enabling you to refine your forecasts and make more informed investment choices.
Discounted Cash Flow (DCF) - (USD MM)
| Year | AY1 2020 |
AY2 2021 |
AY3 2022 |
AY4 2023 |
AY5 2024 |
FY1 2025 |
FY2 2026 |
FY3 2027 |
FY4 2028 |
FY5 2029 |
|---|---|---|---|---|---|---|---|---|---|---|
| Revenue | 1,758.3 | 1,423.3 | 1,568.0 | 1,123.5 | 1,220.5 | 1,133.3 | 1,052.3 | 977.0 | 907.2 | 842.3 |
| Revenue Growth, % | 0 | -19.05 | 10.17 | -28.35 | 8.63 | -7.15 | -7.15 | -7.15 | -7.15 | -7.15 |
| EBITDA | 273.8 | 171.3 | 215.8 | 44.9 | 143.4 | 129.4 | 120.2 | 111.6 | 103.6 | 96.2 |
| EBITDA, % | 15.57 | 12.04 | 13.76 | 4 | 11.75 | 11.42 | 11.42 | 11.42 | 11.42 | 11.42 |
| Depreciation | 75.6 | 75.2 | 88.2 | 88.3 | 86.1 | 68.3 | 63.4 | 58.8 | 54.6 | 50.7 |
| Depreciation, % | 4.3 | 5.28 | 5.62 | 7.86 | 7.05 | 6.02 | 6.02 | 6.02 | 6.02 | 6.02 |
| EBIT | 198.2 | 96.2 | 127.6 | -43.4 | 57.3 | 61.2 | 56.8 | 52.8 | 49.0 | 45.5 |
| EBIT, % | 11.27 | 6.76 | 8.14 | -3.86 | 4.7 | 5.4 | 5.4 | 5.4 | 5.4 | 5.4 |
| Total Cash | 398.5 | 968.6 | 916.4 | 986.1 | 916.6 | 707.2 | 656.7 | 609.7 | 566.1 | 525.7 |
| Total Cash, percent | .0 | .0 | .0 | .0 | .0 | .0 | .0 | .0 | .0 | .0 |
| Account Receivables | 640.5 | 512.8 | 491.7 | 282.5 | 363.6 | 359.8 | 334.1 | 310.2 | 288.0 | 267.4 |
| Account Receivables, % | 36.43 | 36.03 | 31.36 | 25.15 | 29.79 | 31.75 | 31.75 | 31.75 | 31.75 | 31.75 |
| Inventories | 230.3 | 305.4 | 237.1 | 194.6 | 171.5 | 183.7 | 170.5 | 158.4 | 147.0 | 136.5 |
| Inventories, % | 13.1 | 21.45 | 15.12 | 17.32 | 14.05 | 16.21 | 16.21 | 16.21 | 16.21 | 16.21 |
| Accounts Payable | 492.7 | 350.2 | 311.6 | 186.3 | 251.1 | 248.5 | 230.8 | 214.3 | 199.0 | 184.7 |
| Accounts Payable, % | 28.02 | 24.6 | 19.87 | 16.58 | 20.57 | 21.93 | 21.93 | 21.93 | 21.93 | 21.93 |
| Capital Expenditure | -105.5 | -95.8 | -174.5 | -176.4 | -114.1 | -110.9 | -102.9 | -95.6 | -88.7 | -82.4 |
| Capital Expenditure, % | -6 | -6.73 | -11.13 | -15.7 | -9.35 | -9.78 | -9.78 | -9.78 | -9.78 | -9.78 |
| Tax Rate, % | 7.3 | 7.3 | 7.3 | 7.3 | 7.3 | 7.3 | 7.3 | 7.3 | 7.3 | 7.3 |
| EBITAT | 173.8 | 90.1 | 117.0 | -61.2 | 53.1 | 57.0 | 52.9 | 49.1 | 45.6 | 42.4 |
| Depreciation | ||||||||||
| Changes in Account Receivables | ||||||||||
| Changes in Inventories | ||||||||||
| Changes in Accounts Payable | ||||||||||
| Capital Expenditure | ||||||||||
| UFCF | -234.2 | -20.5 | 81.5 | -22.9 | 31.9 | 3.4 | 34.5 | 32.0 | 29.7 | 27.6 |
| WACC, % | 4.67 | 4.67 | 4.67 | 4.68 | 4.67 | 4.67 | 4.67 | 4.67 | 4.67 | 4.67 |
| PV UFCF | ||||||||||
| SUM PV UFCF | 109.4 | |||||||||
| Long Term Growth Rate, % | 3.00 | |||||||||
| Free cash flow (T + 1) | 28 | |||||||||
| Terminal Value | 1,699 | |||||||||
| Present Terminal Value | 1,352 | |||||||||
| Enterprise Value | 1,461 | |||||||||
| Net Debt | -857 | |||||||||
| Equity Value | 2,318 | |||||||||
| Diluted Shares Outstanding, MM | 408 | |||||||||
| Equity Value Per Share | 5.68 |
What You'll Receive
- Customizable Excel Template: A fully adaptable DCF Calculator in Excel format, featuring pre-filled financial data for Guangdong Green Precision Components Co., Ltd (300968SZ).
- Accurate Financial Data: Access to historical figures and forward-looking projections (highlighted in the yellow cells).
- Adjustable Forecasts: Modify key assumptions such as revenue growth, EBITDA percentages, and WACC easily.
- Real-Time Calculations: Instantly observe how your modifications affect the valuation of Guangdong Green Precision Components Co., Ltd (300968SZ).
- Professional-Grade Tool: Designed for investors, CFOs, consultants, and financial analysts alike.
- User-Friendly Interface: Organized for clarity and simplicity, complete with step-by-step guidance.
Key Features
- 🔍 Real-Life GGP Financials: Pre-filled historical and projected data for Guangdong Green Precision Components Co., Ltd (300968SZ).
- ✏️ Fully Customizable Inputs: Tailor all essential parameters (yellow cells) such as WACC, growth %, and tax rates.
- 📊 Professional DCF Valuation: Integrated formulas compute the intrinsic value of GGP using the Discounted Cash Flow method.
- ⚡ Instant Results: Visualize GGP’s valuation immediately after making adjustments.
- Scenario Analysis: Evaluate and compare results for different financial assumptions side-by-side.
How It Works
- Step 1: Download the prebuilt Excel template that contains Guangdong Green Precision Components Co., Ltd's data.
- Step 2: Navigate through the pre-filled sheets to familiarize yourself with the essential metrics.
- Step 3: Modify forecasts and assumptions in the editable yellow cells (WACC, growth rates, margins).
- Step 4: Instantly see the updated results, including the intrinsic value of Guangdong Green Precision Components Co., Ltd (300968SZ).
- Step 5: Use the outputs to make well-informed investment decisions or create detailed reports.
Why Choose This Calculator for Guangdong Green Precision Components Co., Ltd (300968SZ)?
- User-Friendly Interface: Tailored for both novice and seasoned users.
- Customizable Inputs: Adapt parameters easily to fit your specific analysis.
- Real-Time Updates: Observe immediate changes to Guangdong Green's valuation as you modify inputs.
- Preloaded Data: Comes with Guangdong Green's actual financial information for swift assessments.
- Preferred by Industry Experts: Utilized by investors and analysts for informed decision-making.
Who Can Benefit from This Product?
- Professional Investors: Create comprehensive and accurate valuation models for analyzing portfolios involving (300968SZ).
- Corporate Finance Teams: Evaluate valuation scenarios to inform strategic planning within their organizations.
- Consultants and Advisors: Deliver precise valuation insights to clients interested in (300968SZ).
- Students and Educators: Utilize real-world data for hands-on experience in financial modeling and teaching.
- Industry Enthusiasts: Gain insights into how companies like Guangdong Green Precision Components Co., Ltd are assessed in the marketplace.
Contents of the Template
- Pre-Filled Data: Contains historical financials and projections for Guangdong Green Precision Components Co., Ltd (300968SZ).
- Discounted Cash Flow Model: An editable DCF valuation model featuring automatic calculations.
- Weighted Average Cost of Capital (WACC): A dedicated worksheet for computing WACC based on user-defined inputs.
- Key Financial Ratios: Evaluate the profitability, efficiency, and leverage of Guangdong Green Precision Components Co., Ltd (300968SZ).
- Customizable Inputs: Adjust revenue growth, margins, and tax rates easily.
- Clear Dashboard: Visual representations and tables that summarize essential valuation outcomes.
Disclaimer
All information, articles, and product details provided on this website are for general informational and educational purposes only. We do not claim any ownership over, nor do we intend to infringe upon, any trademarks, copyrights, logos, brand names, or other intellectual property mentioned or depicted on this site. Such intellectual property remains the property of its respective owners, and any references here are made solely for identification or informational purposes, without implying any affiliation, endorsement, or partnership.
We make no representations or warranties, express or implied, regarding the accuracy, completeness, or suitability of any content or products presented. Nothing on this website should be construed as legal, tax, investment, financial, medical, or other professional advice. In addition, no part of this site—including articles or product references—constitutes a solicitation, recommendation, endorsement, advertisement, or offer to buy or sell any securities, franchises, or other financial instruments, particularly in jurisdictions where such activity would be unlawful.
All content is of a general nature and may not address the specific circumstances of any individual or entity. It is not a substitute for professional advice or services. Any actions you take based on the information provided here are strictly at your own risk. You accept full responsibility for any decisions or outcomes arising from your use of this website and agree to release us from any liability in connection with your use of, or reliance upon, the content or products found herein.