
|
Kobe Bussan Co., Ltd. (3038.T) DCF Valuation |
Fully Editable: Tailor To Your Needs In Excel Or Sheets
Professional Design: Trusted, Industry-Standard Templates
Investor-Approved Valuation Models
MAC/PC Compatible, Fully Unlocked
No Expertise Is Needed; Easy To Follow
Kobe Bussan Co., Ltd. (3038.T) Bundle
Enhance your investment strategies with the (3038T) DCF Calculator! Explore authentic financial data for Kobe Bussan Co., Ltd., adjust growth projections and expenses, and instantly observe how these modifications influence the intrinsic value of Kobe Bussan.
What You Will Receive
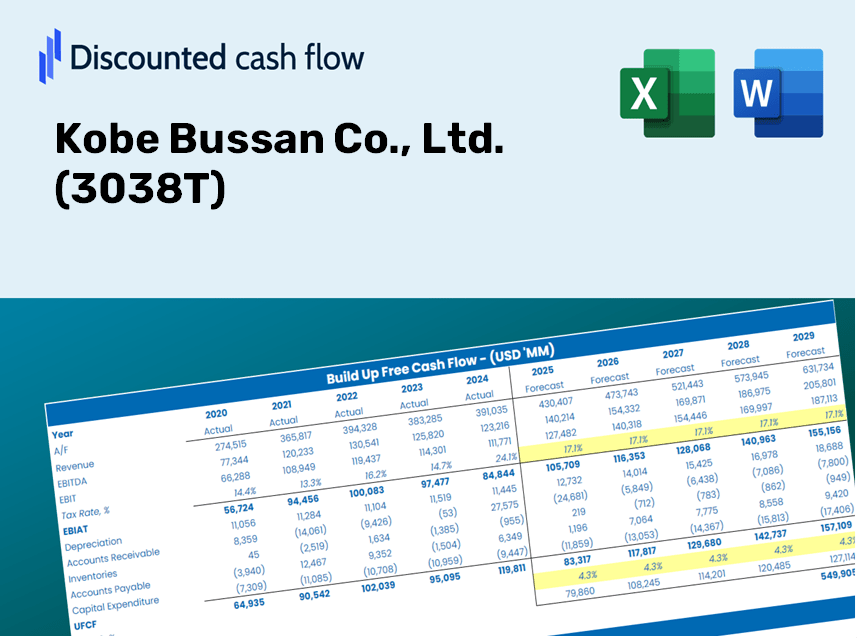
- Accurate 3038T Financial Data: Access to historical and projected figures for precise assessment.
- Customizable Inputs: Adjust WACC, tax rates, revenue growth, and capital expenditures to fit your analysis.
- Automated Calculations: Real-time computation of intrinsic value and NPV.
- Scenario Evaluation: Analyze various scenarios to forecast Kobe Bussan's future outcomes.
- User-Friendly Interface: Designed for professionals but easy for newcomers to navigate.
Key Features
- Customizable Forecast Inputs: Adjust essential parameters such as sales growth, operating margin, and capital investments.
- Instant DCF Valuation: Provides immediate calculations for intrinsic value, net present value (NPV), and additional financial metrics.
- High-Precision Results: Relies on Kobe Bussan Co., Ltd.'s (3038T) actual financial data for accurate valuation analyses.
- Simplified Scenario Analysis: Effortlessly test various assumptions and evaluate different outcomes.
- Efficiency Booster: Remove the hassle of constructing complex valuation models from the ground up.
How It Functions
- Download: Obtain the pre-prepared Excel file containing Kobe Bussan Co., Ltd.'s (3038T) financial data.
- Customize: Modify forecasts such as revenue growth, EBITDA percentages, and WACC.
- Real-Time Updates: Calculations for intrinsic value and NPV refresh automatically as you make changes.
- Scenario Testing: Generate various projections and analyze outcomes immediately.
- Informed Decision-Making: Leverage the valuation results to shape your investment strategy.
Why Opt for This Calculator?
- Designed for Experts: A sophisticated tool utilized by analysts, CFOs, and consultants.
- Actual Financial Data: Kobe Bussan’s historical and projected financials integrated for precision.
- Scenario Analysis: Effortlessly test various forecasts and assumptions.
- Transparent Results: Instantly computes intrinsic value, NPV, and essential metrics.
- User-Friendly: Step-by-step guidance ensures a smooth experience.
Who Can Benefit from This Product?
- Investors: Evaluate Kobe Bussan Co., Ltd. (3038T)'s valuation prior to making investment decisions.
- Chief Financial Officers and Financial Analysts: Enhance valuation methodologies and assess financial forecasts.
- Entrepreneurs: Understand the valuation practices of established companies like Kobe Bussan Co., Ltd. (3038T).
- Consultants: Provide clients with thorough and professional valuation reports.
- Academics and Students: Utilize actual market data to learn and instruct on valuation strategies.
What the Template Includes
- Historical Data: Contains Kobe Bussan Co., Ltd.'s (3038T) previous financial performance and foundational forecasts.
- DCF and Levered DCF Models: Comprehensive templates to assess the intrinsic value of Kobe Bussan Co., Ltd. (3038T).
- WACC Sheet: Pre-calculated metrics for Weighted Average Cost of Capital.
- Editable Inputs: Adjust critical drivers such as growth rates, EBITDA percentages, and CAPEX projections.
- Quarterly and Annual Statements: Detailed insights into the financials of Kobe Bussan Co., Ltd. (3038T).
- Interactive Dashboard: Dynamically visualize valuation outcomes and forecasts.
Disclaimer
All information, articles, and product details provided on this website are for general informational and educational purposes only. We do not claim any ownership over, nor do we intend to infringe upon, any trademarks, copyrights, logos, brand names, or other intellectual property mentioned or depicted on this site. Such intellectual property remains the property of its respective owners, and any references here are made solely for identification or informational purposes, without implying any affiliation, endorsement, or partnership.
We make no representations or warranties, express or implied, regarding the accuracy, completeness, or suitability of any content or products presented. Nothing on this website should be construed as legal, tax, investment, financial, medical, or other professional advice. In addition, no part of this site—including articles or product references—constitutes a solicitation, recommendation, endorsement, advertisement, or offer to buy or sell any securities, franchises, or other financial instruments, particularly in jurisdictions where such activity would be unlawful.
All content is of a general nature and may not address the specific circumstances of any individual or entity. It is not a substitute for professional advice or services. Any actions you take based on the information provided here are strictly at your own risk. You accept full responsibility for any decisions or outcomes arising from your use of this website and agree to release us from any liability in connection with your use of, or reliance upon, the content or products found herein.