
|
JINS HOLDINGS Inc. (3046.T) DCF Valuation |
Fully Editable: Tailor To Your Needs In Excel Or Sheets
Professional Design: Trusted, Industry-Standard Templates
Investor-Approved Valuation Models
MAC/PC Compatible, Fully Unlocked
No Expertise Is Needed; Easy To Follow
JINS HOLDINGS Inc. (3046.T) Bundle
As an investor or analyst, the JINS HOLDINGS Inc. (3046T) DCF Calculator is your essential tool for accurate valuation. Equipped with real data from JINS HOLDINGS Inc., you can adjust your forecasts and observe the effects in real-time.
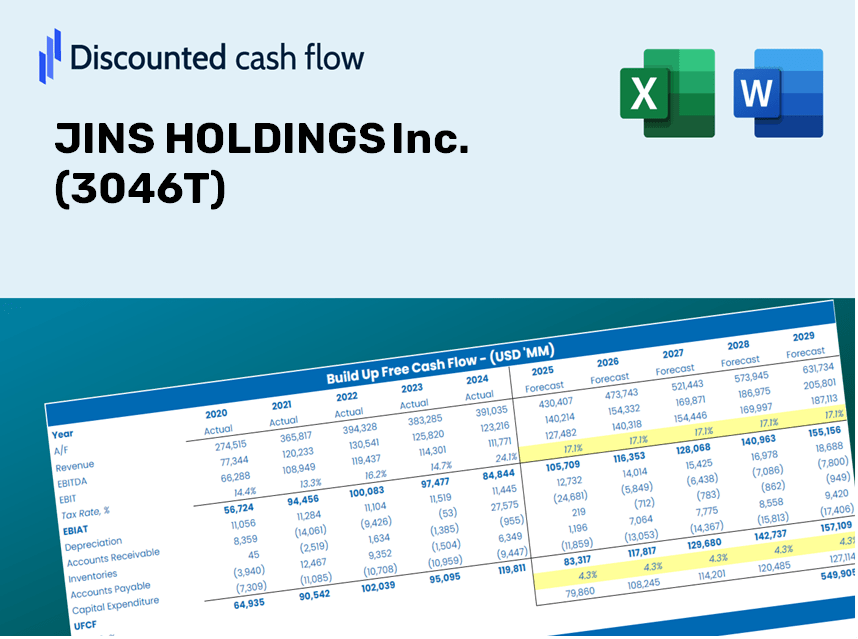
Discounted Cash Flow (DCF) - (USD MM)
| Year | AY1 2020 |
AY2 2021 |
AY3 2022 |
AY4 2023 |
AY5 2024 |
FY1 2025 |
FY2 2026 |
FY3 2027 |
FY4 2028 |
FY5 2029 |
|---|---|---|---|---|---|---|---|---|---|---|
| Revenue | 60,258.0 | 63,898.0 | 66,901.0 | 73,264.0 | 82,999.0 | 89,958.3 | 97,501.0 | 105,676.3 | 114,536.9 | 124,140.6 |
| Revenue Growth, % | 0 | 6.04 | 4.7 | 9.51 | 13.29 | 8.38 | 8.38 | 8.38 | 8.38 | 8.38 |
| EBITDA | 6,811.0 | 7,229.0 | 5,204.0 | 5,943.0 | 10,260.0 | 9,152.1 | 9,919.4 | 10,751.2 | 11,652.6 | 12,629.7 |
| EBITDA, % | 11.3 | 11.31 | 7.78 | 8.11 | 12.36 | 10.17 | 10.17 | 10.17 | 10.17 | 10.17 |
| Depreciation | 2,858.0 | 2,695.0 | 2,950.0 | 2,918.0 | 2,926.0 | 3,756.4 | 4,071.3 | 4,412.7 | 4,782.7 | 5,183.7 |
| Depreciation, % | 4.74 | 4.22 | 4.41 | 3.98 | 3.53 | 4.18 | 4.18 | 4.18 | 4.18 | 4.18 |
| EBIT | 3,953.0 | 4,534.0 | 2,254.0 | 3,025.0 | 7,334.0 | 5,395.7 | 5,848.1 | 6,338.5 | 6,870.0 | 7,446.0 |
| EBIT, % | 6.56 | 7.1 | 3.37 | 4.13 | 8.84 | 6 | 6 | 6 | 6 | 6 |
| Total Cash | 24,667.0 | 23,206.0 | 21,430.0 | 12,202.0 | 18,673.0 | 26,706.4 | 28,945.7 | 31,372.7 | 34,003.3 | 36,854.4 |
| Total Cash, percent | .0 | .0 | .0 | .0 | .0 | .0 | .0 | .0 | .0 | .0 |
| Account Receivables | 4,484.0 | 3,794.0 | 4,514.0 | 5,059.0 | 6,572.0 | 6,288.0 | 6,815.2 | 7,386.7 | 8,006.0 | 8,677.3 |
| Account Receivables, % | 7.44 | 5.94 | 6.75 | 6.91 | 7.92 | 6.99 | 6.99 | 6.99 | 6.99 | 6.99 |
| Inventories | 4,585.0 | 4,874.0 | 5,852.0 | 4,581.0 | 5,106.0 | 6,546.9 | 7,095.9 | 7,690.8 | 8,335.7 | 9,034.6 |
| Inventories, % | 7.61 | 7.63 | 8.75 | 6.25 | 6.15 | 7.28 | 7.28 | 7.28 | 7.28 | 7.28 |
| Accounts Payable | 1,745.0 | 1,506.0 | 2,535.0 | 1,745.0 | 2,747.0 | 2,650.8 | 2,873.0 | 3,113.9 | 3,375.0 | 3,658.0 |
| Accounts Payable, % | 2.9 | 2.36 | 3.79 | 2.38 | 3.31 | 2.95 | 2.95 | 2.95 | 2.95 | 2.95 |
| Capital Expenditure | -2,586.0 | -1,931.0 | -3,210.0 | -3,594.0 | -1,886.0 | -3,470.5 | -3,761.5 | -4,076.9 | -4,418.7 | -4,789.2 |
| Capital Expenditure, % | -4.29 | -3.02 | -4.8 | -4.91 | -2.27 | -3.86 | -3.86 | -3.86 | -3.86 | -3.86 |
| Tax Rate, % | 35.14 | 35.14 | 35.14 | 35.14 | 35.14 | 35.14 | 35.14 | 35.14 | 35.14 | 35.14 |
| EBITAT | 1,811.7 | 3,414.0 | 803.1 | 1,848.1 | 4,756.6 | 3,050.8 | 3,306.6 | 3,583.9 | 3,884.4 | 4,210.1 |
| Depreciation | ||||||||||
| Changes in Account Receivables | ||||||||||
| Changes in Inventories | ||||||||||
| Changes in Accounts Payable | ||||||||||
| Capital Expenditure | ||||||||||
| UFCF | -5,240.3 | 4,340.0 | -125.9 | 1,108.1 | 4,760.6 | 2,083.6 | 2,762.5 | 2,994.2 | 3,245.2 | 3,517.3 |
| WACC, % | 4.35 | 4.42 | 4.33 | 4.39 | 4.4 | 4.38 | 4.38 | 4.38 | 4.38 | 4.38 |
| PV UFCF | ||||||||||
| SUM PV UFCF | 12,738.2 | |||||||||
| Long Term Growth Rate, % | 3.20 | |||||||||
| Free cash flow (T + 1) | 3,630 | |||||||||
| Terminal Value | 308,363 | |||||||||
| Present Terminal Value | 248,906 | |||||||||
| Enterprise Value | 261,645 | |||||||||
| Net Debt | -6,300 | |||||||||
| Equity Value | 267,945 | |||||||||
| Diluted Shares Outstanding, MM | 24 | |||||||||
| Equity Value Per Share | 10,969.03 |
What You Will Receive
- Accurate JINS HOLDINGS Financials: Access historical and projected data for precise valuation.
- Customizable Inputs: Adjust WACC, tax rates, revenue growth, and capital expenditures as needed.
- Automated Calculations: Intrinsic value and NPV are calculated in real-time.
- Scenario Analysis: Explore various scenarios to assess JINS HOLDINGS’ future performance.
- User-Friendly Design: Designed for experts while remaining accessible for novices.
Key Features
- Real-Time JINS Data: Pre-loaded with JINS HOLDINGS Inc.'s historical financial data and future projections.
- Comprehensive Customization: Tailor revenue growth, profit margins, WACC, tax rates, and capital expenditures according to your preferences.
- Interactive Valuation Framework: Instantly updates Net Present Value (NPV) and intrinsic value as you modify inputs.
- Scenario Analysis: Develop various forecasting scenarios to evaluate different valuation results.
- Intuitive Interface: Designed with simplicity in mind, suitable for both experienced professionals and newcomers.
How It Functions
- Download: Obtain the pre-configured Excel file containing JINS HOLDINGS Inc.'s (3046T) financial data.
- Customize: Modify forecasts such as revenue growth, EBITDA margin, and WACC.
- Automatic Updates: Watch as intrinsic value and NPV calculations refresh in real-time.
- Scenario Testing: Generate various projections and instantly evaluate different outcomes.
- Decision Making: Leverage the valuation results to inform your investment strategy.
Why Opt for This Calculator for JINS HOLDINGS Inc. (3046T)?
- Designed for Experts: An advanced tool favored by analysts, CFOs, and consultants.
- Comprehensive Data: JINS HOLDINGS' historical and projected financials preloaded for enhanced accuracy.
- Scenario Simulation: Effortlessly test various forecasts and assumptions.
- Clear Results: Instantly calculates intrinsic value, NPV, and essential metrics.
- User-Friendly: Clear, step-by-step guidance ensures a smooth experience.
Who Can Benefit from This Product?
- Investors: Accurately assess the fair value of JINS HOLDINGS Inc. (3046T) before making investment choices.
- CFOs: Utilize a professional-grade DCF model for comprehensive financial reporting and analysis.
- Consultants: Efficiently customize the template for valuation reports tailored to clients.
- Entrepreneurs: Acquire insights into the financial modeling practices of Fortune 500 companies.
- Educators: Employ it as a teaching resource to illustrate various valuation methodologies.
Contents of the Template
- Preloaded JINS HOLDINGS Data: Historical and forecasted financial metrics, including revenue, EBIT, and capital expenditures.
- DCF and WACC Models: Advanced spreadsheets for computing intrinsic value and Weighted Average Cost of Capital.
- Editable Inputs: Yellow-highlighted fields for modifying revenue growth, tax rates, and discount rates.
- Financial Statements: Detailed annual and quarterly financial statements for in-depth analysis.
- Key Ratios: Metrics for profitability, leverage, and efficiency to assess company performance.
- Dashboard and Charts: Visual representations of valuation results and underlying assumptions.
Disclaimer
All information, articles, and product details provided on this website are for general informational and educational purposes only. We do not claim any ownership over, nor do we intend to infringe upon, any trademarks, copyrights, logos, brand names, or other intellectual property mentioned or depicted on this site. Such intellectual property remains the property of its respective owners, and any references here are made solely for identification or informational purposes, without implying any affiliation, endorsement, or partnership.
We make no representations or warranties, express or implied, regarding the accuracy, completeness, or suitability of any content or products presented. Nothing on this website should be construed as legal, tax, investment, financial, medical, or other professional advice. In addition, no part of this site—including articles or product references—constitutes a solicitation, recommendation, endorsement, advertisement, or offer to buy or sell any securities, franchises, or other financial instruments, particularly in jurisdictions where such activity would be unlawful.
All content is of a general nature and may not address the specific circumstances of any individual or entity. It is not a substitute for professional advice or services. Any actions you take based on the information provided here are strictly at your own risk. You accept full responsibility for any decisions or outcomes arising from your use of this website and agree to release us from any liability in connection with your use of, or reliance upon, the content or products found herein.